Google has rolled out Chrome 133, bringing a host of innovative updates to DevTools that promise to make debugging, performance tracking, and web development more seamless than ever before.
This latest iteration introduces a locally persistent AI chat history, a more intuitive Performance Panel, enhanced debugging tools, and the powerful Lighthouse 12.3.0.
Whether you’re a seasoned developer or just starting, Chrome 133 aims to elevate your workflow efficiency.
Let’s explore the key highlights and their impact on developers.
AI-Powered Chat History
One of the most exciting additions in Chrome 133 is the Persistent AI Chat History. Developers relying on AI-driven insights within DevTools can now view their previous chat interactions even after closing or refreshing the browser.
This eliminates the need to manually re-enter queries or remember past recommendations, ensuring a continuous and uninterrupted development workflow.
Google is strengthening its dedication to enhancing DevTools by incorporating AI-driven persistence, making them more friendly for developers and context-aware, which accelerates debugging and problem-solving efforts.
Performance Panel Gets a Major Boost
The Performance Panel has undergone significant enhancements aimed at improving analysis efficiency and usability.
Here’s what’s new:
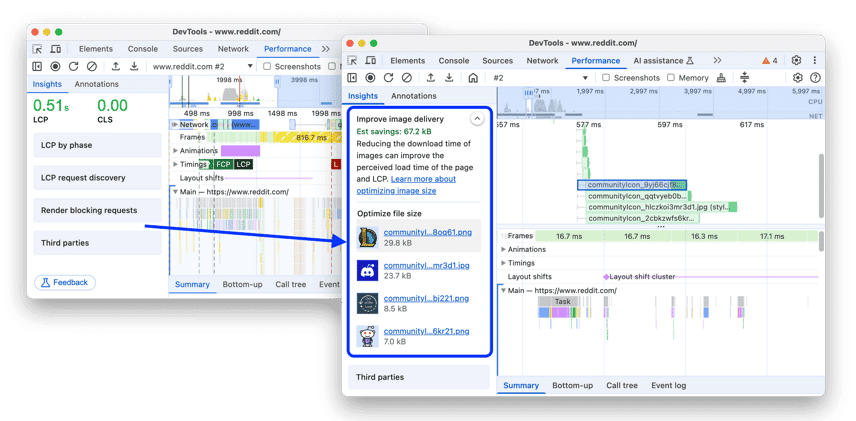
Image Delivery Insights
The Performance > Insights tab now highlights large image files that can be optimized. Developers can click on flagged images to see them pinpointed in the Network track, making it easier to adjust file sizes and enhance page speed.
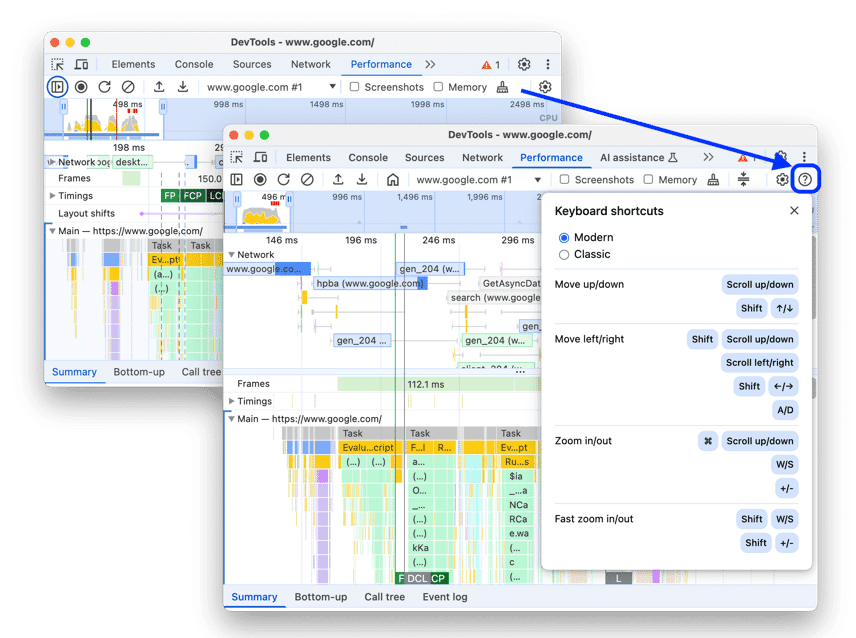
Customizable Keyboard Navigation
Developers can now choose between Classic and Modern navigation styles. Classic mode enables zooming with the mouse wheel and vertical scrolling with Shift + mouse wheel, while Modern mode supports vertical scrolling with the mouse wheel and horizontal scrolling with Shift + mouse wheel.
Ignore Irrelevant Scripts in the Flame Chart
To help developers focus on their code, Chrome 133 now allows users to add irrelevant scripts to an ignore list. This helps reduce excessive nesting and improves code traceability.
Timeline Marker and Range Highlighting
Hovering over the Timeline now presents a vertical marker spanning the entire performance trace, providing clear insights into execution flow.
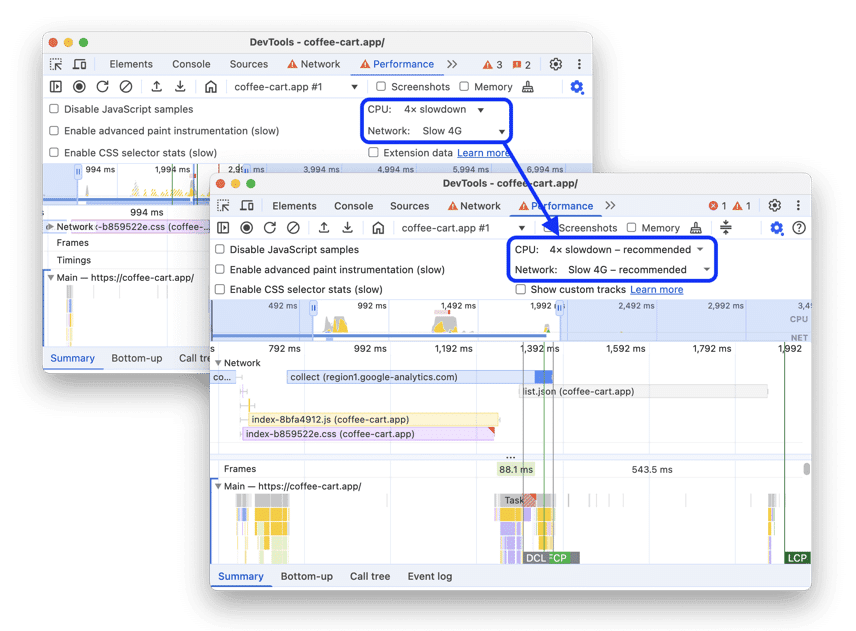
Recommended Throttling Settings
Chrome now recommends CPU and network throttling settings based on Chrome UX Report data, ensuring developers test their applications under conditions that reflect real-world performance.
With these refinements, developers can now pinpoint bottlenecks, streamline debugging, and optimize performance with greater precision.
Lighthouse 12.3.0: Stronger Security and Performance Audits
Chrome 133 also brings Lighthouse 12.3.0, the latest version of Chrome’s built-in website auditing tool. Key updates include:
- Origin Isolation Checks: Lighthouse now verifies if a website correctly implements Cross-Origin-Opener-Policy (COOP), which helps prevent cross-origin attacks.
- Stronger HSTS Policy Audits: Developers can now ensure their websites enforce HTTP Strict Transport Security (HSTS), a critical security measure for protecting user data.
- Stack Traces for JavaScript Calls: The Performance > Summary tab now displays detailed stack traces, including async calls, making it easier to track down slow-running scripts.
These updates not only enhance security compliance but also streamline performance audits, ensuring developers can build safer, faster, and more reliable websites.
Refining the Developer Experience
Chrome 133 is not just about performance; it also introduces several usability improvements to make DevTools more intuitive. Here are some notable changes:
- Badge Settings Relocation: The Elements panel now houses badge settings in a dedicated right-click menu for easier access.
- Redesigned ‘What’s New’ Panel: The new design aligns with Chrome’s latest UI updates, offering a cleaner and more navigable experience.
- Improved Debugging Behavior: The Debugger now prevents unexpected context switching to a service worker context after a pause, improving accuracy.
- Updated Flame Chart Tooltips: URLs are now displayed when hovering over scripts, providing better traceability.
- Storage Updates: Developers can now create storage entries with empty keys, a technically valid but previously unsupported feature.
- Device Mode Adjustments: Device Mode is now disabled for chrome:// pages.
- Enhanced HAR Export: Instead of a long-click, clicking Export HAR now opens a menu with two options: sanitized data or sensitive data.
These enhancements ensure that Chrome DevTools remains a cutting-edge tool, catering to the evolving needs of developers worldwide.
What This Means for Developers
With Chrome 133, Google has once again demonstrated its commitment to refining the developer experience.
This update provides developers with powerful tools to build more efficient and secure web applications by integrating AI-driven chat history, improving performance analysis, and strengthening security audits.
Whether debugging scripts, optimizing load times, or ensuring compliance with security protocols, Chrome 133 streamlines the process like never before.
The Bottom Line
With these substantial improvements, Chrome DevTools 133 isn’t just another routine update—it’s a big leap forward in web development efficiency.
By making debugging smarter, performance analysis sharper, and usability smoother, Chrome 133 sets a new standard for browser-based developer tools.
Key Takeaways
- Developers can now retain AI-generated debugging insights across sessions.
- Image optimization tools, customizable navigation, and script ignore lists improve efficiency.
- Improved security audits, origin isolation checks, and async stack traces streamline performance evaluations.
- Redesigned interfaces, enhanced debugging accuracy, and better accessibility options refine the development workflow.
- Recommended throttling settings ensure more realistic performance testing conditions.

Dileep Thekkethil
AuthorDileep Thekkethil is the Director of Marketing at Stan Ventures, where he applies over 15 years of SEO and digital marketing expertise to drive growth and authority. A former journalist with six years of experience, he combines strategic storytelling with technical know-how to help brands navigate the shift toward AI-driven search and generative engines. Dileep is a strong advocate for Google’s EEAT standards, regularly sharing real-world use cases and scenarios to demystify complex marketing trends. He is an avid gardener of tropical fruits, a motor enthusiast, and a dedicated caretaker of his pair of cockatiels.