
Indexation Research 2026
We Checked 1,544 Guest Posts. Domain Rating Did Not Predict Which Ones Google Indexed.
Fifty six of them never made it into the index. The articles weren’t the problem. The sites were. One publisher metric separated the good ones from the bad ones, and it’s probably not the metric your reports are built on.
1,488 of 1,544 placements. The true rate sits somewhere between 95.4% and 97.2%.
Every one had already passed our vetting before an article went out.
Eight domains carried 44.6% of every failure in the set.
Median, from order to live URL. Covers outreach, writing, approvals and the publisher’s own queue.
The Short Version
Six Findings From 1,544 Placements
- 96.4% of placements got indexed. The 56 that didn’t weren’t spread evenly. They piled up on a short list of sites.
- Domain Rating didn’t separate the good sites from the bad ones. Split the inventory into four equal groups by DR and the index rates go 94.5%, 97.9%, 96.6%, 96.4%. That spread is inside normal variation.
- Organic traffic value did separate them. Same inventory, four equal groups by traffic value: 91.0%, 96.3%, 99.7%, 98.2%.
- The worst profile in the whole dataset is high authority with no audience. DR 50 or above with under 1,000 monthly visits indexed at 89.6% against 97.0% everywhere else.
- Nothing about the article mattered. Not the topic, not whether it was YMYL, not how well it fit the host site, not the URL structure. All of it came back flat.
- A $100 a month traffic value floor would have cut 36.1% of the inventory and avoided 78.6% of the failures.
Read This First
Two Things That Shape Every Number Below
Every one of these 412 sites cleared our publisher vetting before a single article was written. Nobody bought a link on a site we hadn’t already checked. So this isn’t a snapshot of the open market. It’s a snapshot of what’s left after the obvious low quality sites are filtered out.
That makes the Domain Rating result more interesting, not less. Once you’ve done basic vetting, DR stops telling you anything useful. On raw open-market inventory it might still correlate with quality, because it’d be picking up the gross differences our vetting already removed.
Second thing. We take health, finance, legal and other YMYL brands as clients. We just don’t write strong YMYL articles for them. When we build the topic, we deliberately keep the premise away from clinical, diagnostic and advisory territory, because that’s where Google raises the expertise bar and the risk of a page never getting indexed goes up.
So when you read below that YMYL made no difference, read it the narrow way: YMYL-sector clients index at the same rate as everyone else under that topic policy. It is not proof that a hard medical advice piece would have done the same. We never ran that test, and we’re not going to run it on live client work to find out.
Delivery Timing
Sixteen Days Of Human Work. Hours Of Google.
Half of all placements went live within 16 days of the order. That clock covers the whole chain: manual outreach to the site, waiting for the owner to say yes, writing the article, approvals on both sides, and then the owner’s own publishing calendar, which may already have content booked for weeks. Only 4.6% went live inside a week. By day 14 you’re at 45.4%, by day 21 you’re at 84.8%, and by day 28 you’re at 97.0%. If you promise a client links in two weeks, you miss more than half the time.
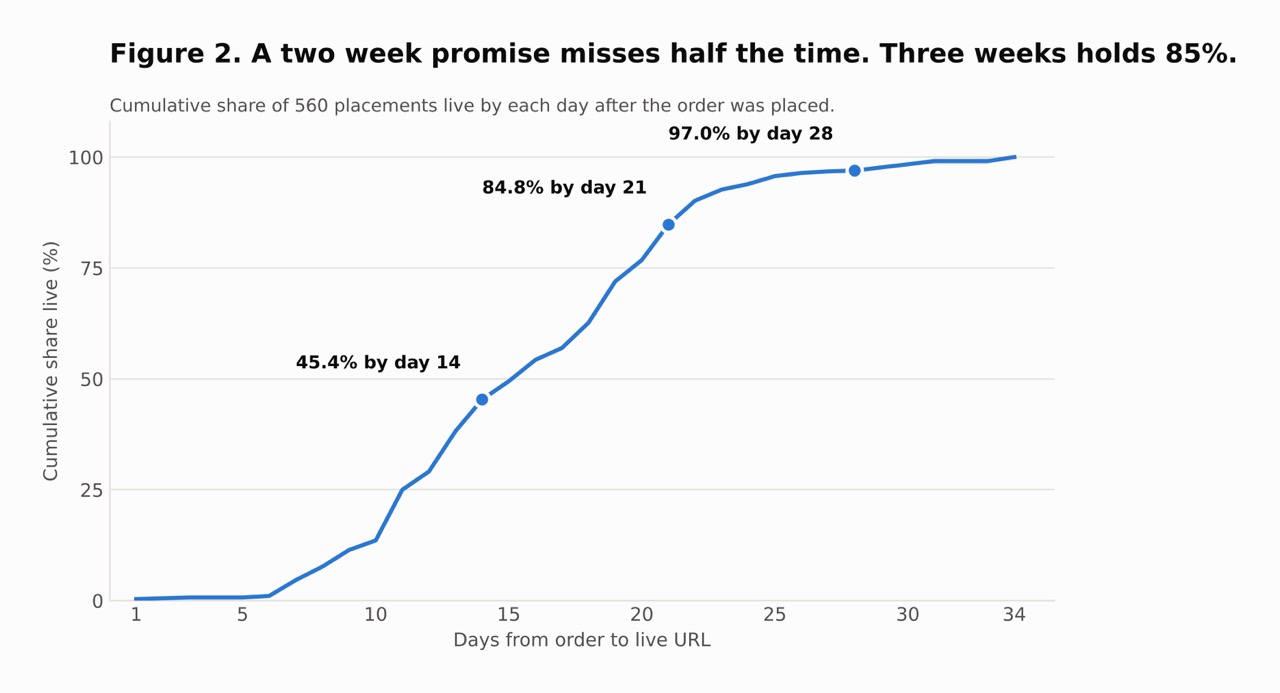
A two week promise misses half the time. Three weeks holds 85%. Based on 560 placements with a complete order date and live date.
Now the part that surprised us. We checked whether pages that sat live longer were more likely to be indexed. They weren’t. Pages checked within 24 hours of going live were already indexed 98.4% of the time. Pages checked two to three weeks later sat at 97.5%. That half point gap sits well inside normal variation. The line is flat.
So on a median placement, roughly 16 days is people doing work and waiting on other people, and a few hours is Google. Which part of the 16 days takes longest is a separate question we haven’t measured; the data here only tells you Google isn’t the bottleneck. And if a page isn’t indexed when you check it, waiting another two weeks is not the fix. That’s worth saying out loud, because “give it time” is the standard answer when a client asks why a link isn’t showing up.
Content Factors
We Tested Six Things About The Article. All Six Came Back Empty.
This is where most of the editorial effort goes, so it’s where we looked hardest. Topic category across 19 niches. YMYL classification. Whether the article matched what the host site normally publishes. How broad the publisher’s topic mix was. URL structure, including dated paths, folder depth, slug length and file extensions. Here’s the scoreboard.
A word on what counts as a real difference. Where we say a gap sits inside normal variation, we tested it and a difference that size occurs often enough at random that it cannot be separated from noise. Where we call a result real, the opposite held: we tried to reproduce it at random and almost never could.
One category did look weak at first. Home services, our biggest at 384 placements, indexed at 94.0% against 97.2% for everything else. Looked like a topic problem.
It wasn’t. Home services articles were over-represented on the eight weakest sites in the set: 16.7% of them landed there against 8.7% of the dataset overall. Take those eight sites out and home services indexes at 98.4%, slightly better than everything else. Dental did the same thing: 91.9% across all domains, 95.7% once the same eight sites are removed.
That’s the lesson that generalizes. Any topic-level pattern in placement data is a publisher-level pattern until you prove otherwise, because nobody assigns topics to publishers at random.
Where Failures Live
90.5% Of Sites Never Failed Once
373 of the 412 publisher sites indexed every single article we placed on them. Every one of the 56 failures came from the other 39 sites, and eight of those carried 25 failures between them.
Clustering on its own doesn’t prove much, since some concentration occurs at random when sites receive different numbers of articles. So we tested it. We held the 412 sites and their placement counts fixed, then scattered the same 56 failures at random across the 1,544 placements 20,000 times and measured how tightly they concentrated each time.
Random chance produced our observed level of clustering in 15 runs out of 20,000, which is about once in every 1,300 tries. It’s the single strongest result in the whole study. Publisher identity is real, it’s measurable, and it’s the thing you can actually act on.
The Main Finding
Traffic Value Sorts Publishers. Domain Rating Doesn’t.
We tested eight publisher metrics from Ahrefs against indexation. Same 1,544 placements each time, split into four equal groups by whichever metric we were testing.
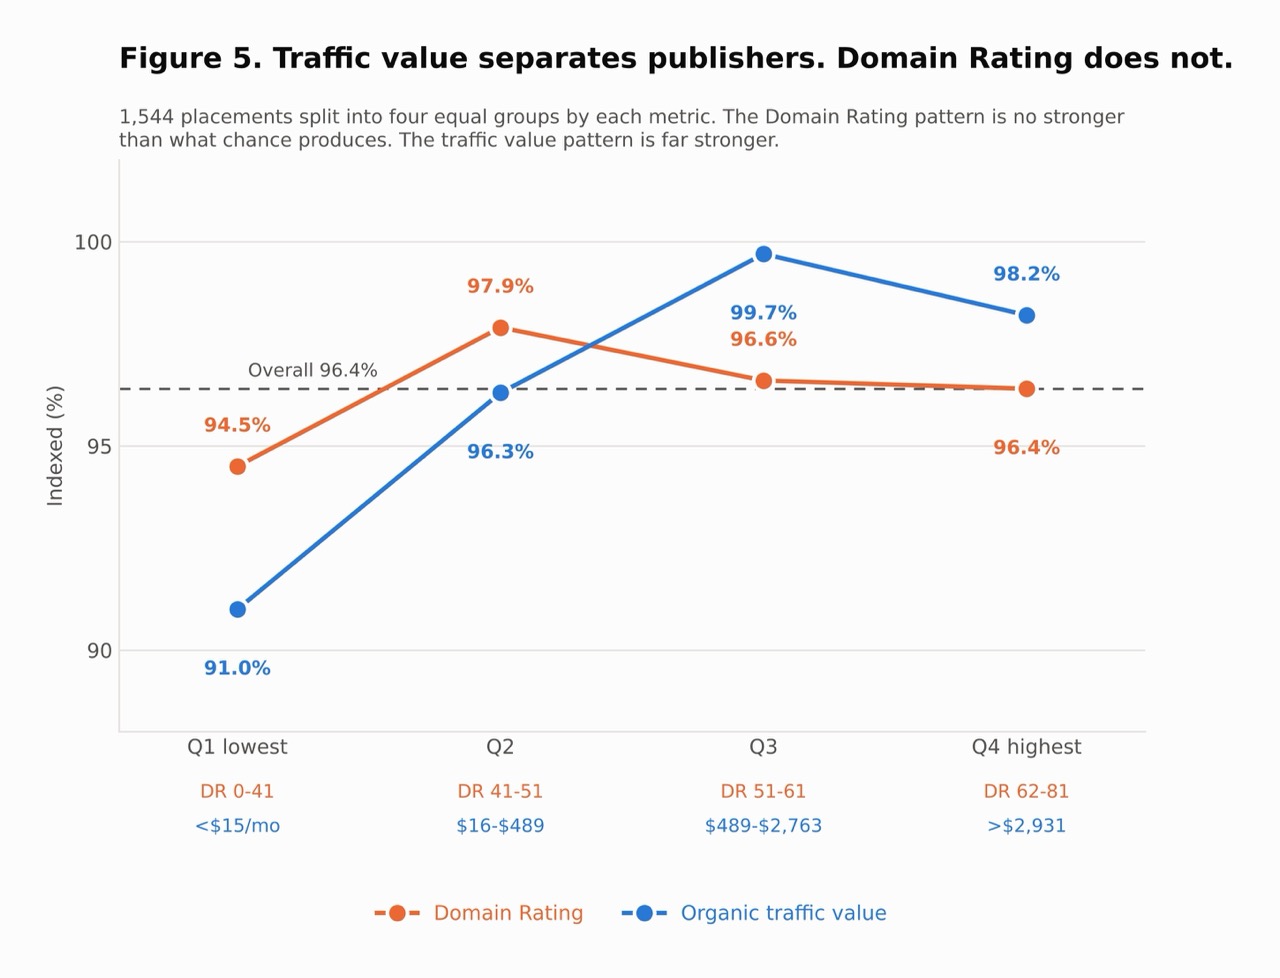
Domain Rating groups go 94.5%, 97.9%, 96.6%, 96.4%. Traffic value groups go 91.0%, 96.3%, 99.7%, 98.2%.
The DR line rises, falls and lands back where it started. A pattern that shape occurs at random roughly one time in eleven, which is too often to call it real. The traffic value line climbs and holds, and a pattern that shape occurs at random about once in fifty million.
Here’s the full ranking. We scored each metric on how much it improved our ability to predict whether an article would be indexed. Higher is better, and the last row is what you get from no metric at all.
The score in the second column is how much each metric improved our predictions compared with ignoring it and just assuming the overall 96.4% rate for every site. Zero means the metric added nothing. The third column is the reliability check: if a metric genuinely told you nothing, that is how often a pattern this strong would still appear at random. Once in 50 million settles the question. Once in 7 is ordinary variation. The formal statistics behind both columns are in the full report linked at the bottom.
Look at where Domain Rating lands. It scores 3.8. Traffic value scores 28.3, more than seven times higher. The metric the entire industry prices on is barely better than the baseline.
One more thing worth pulling out. Test traffic value and raw visit counts side by side and traffic value keeps doing the work while raw visits stop mattering. It’s the commercial quality of the audience that carries the signal, not the headcount.
And one hypothesis of ours died here. We expected sites linking out to thousands of domains, the classic link farm fingerprint, to index badly. Domains linked out to was the weakest of all eight metrics and scored slightly worse than knowing nothing. Outbound link volume told us nothing.
The Expensive Trap
High Authority, No Audience Is The Worst Thing You Can Buy
Split the inventory on both metrics at once and the picture gets blunt.
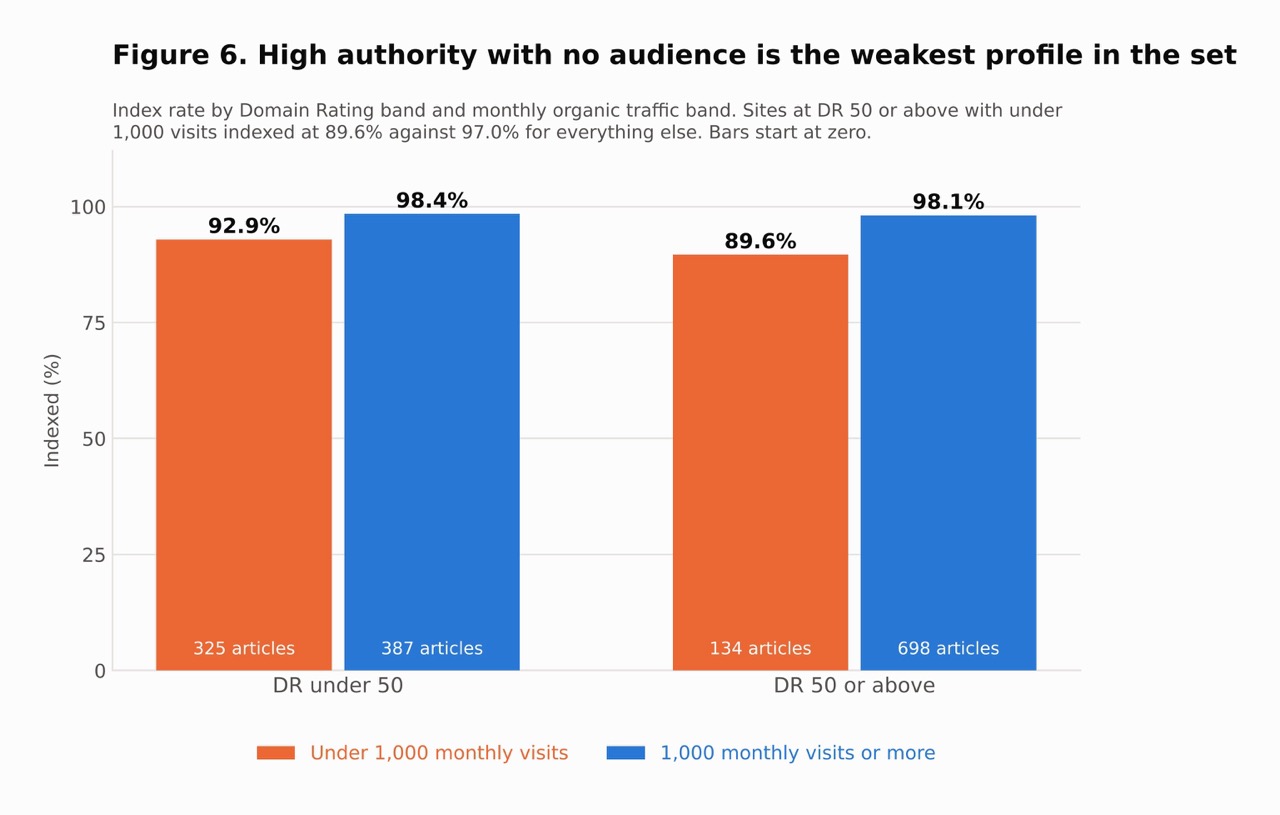
Read across the rows and traffic moves the outcome by five to nine points. Read down the columns and Domain Rating moves it by nothing.
DR 50+, UNDER 1,000 VISITS
134 placements on 30 domains. The weakest cell in the entire grid, and usually the priciest tier on a price list.
DR UNDER 50, UNDER 1,000 VISITS
325 placements on 129 domains. Lower authority, and it indexed better than the cell above it.
ANY DR, 1,000+ VISITS
1,085 placements. Once a site has a real audience, its DR stops mattering.
Tighten the cut and it sharpens. Sites at DR 60 or above with under 1,000 monthly visits indexed at 85.9% against 96.8% everywhere else. On most published price lists, those are the most expensive placements you can buy.
DR and traffic do correlate across the full set, which is exactly why DR looks useful until you control for traffic. The 30 sites where the two numbers disagree are where the failures sit.
The Eight
What The Worst Eight Sites Had In Common
We picked these eight on failure count alone, before looking at a single metric. Publisher names are withheld. What they share is not low authority. Their median DR is 56, which is higher than the 50 median across the other 404 domains. What they share is that nobody reads them.
The eight indexed at 81.3% against 97.8% for every other site. Their median traffic value is 54 times lower. Their median DR is higher.
Monthly visits on Site F. That clears any traffic volume filter you’d ever set. Its traffic is worth $16 a month, which tells you the visits aren’t the kind Google cares about. A volume screen passes this site. A value screen catches it.
Screening Simulation
Where To Set The Floor
We re-ran the whole dataset with a traffic value cutoff and asked a simple question. If we’d refused to buy from any site below this number, how much inventory would we have lost, and how many failures would we have avoided?
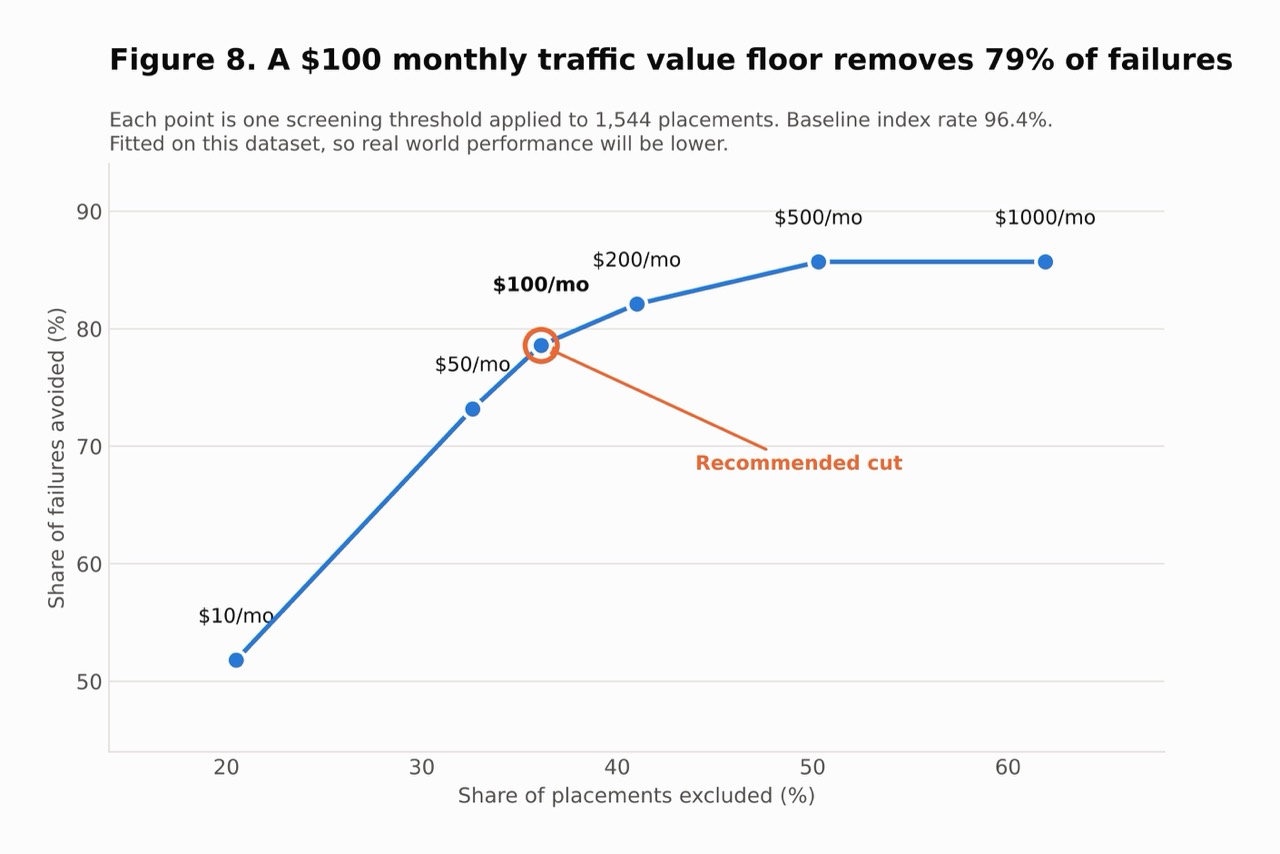
A $100 a month floor is the knee of the curve. Past $500 the curve turns over and you’re paying inventory for nothing.
Baseline across all 412 sites is 96.4%. A $100 floor removes about a third of the inventory and nearly four fifths of the failures. Push to $500 and you give up another 14 points of inventory to catch 7.1 more points of failures. Past that the curve turns over and you’re just buying less.
Screening on raw visits performs worse at every level. A 2,500 visit floor costs 48.3% of placements to catch 80.4% of failures. The value screen hits comparable coverage at 36.1%.
Do This Instead
How To Screen A Publisher In Five Minutes
Everything below comes straight out of the data above. You can run it on any site you’re about to buy from, using any tool that reports organic traffic value.
Pull Traffic Value, Not Just Domain Rating
It’s one field in Ahrefs, Semrush or anything comparable. On our data it carried more than seven times the signal Domain Rating did. If your vendor won’t show it to you, that’s an answer in itself.
Set A Floor Around $100 A Month
That’s where the curve bends on our inventory. Treat it as a starting point, not a law. Traffic value tracks commercial intent, so the right number moves between niches.
Flag High DR With Low Traffic As Its Own Category
DR 50 or above with under 1,000 monthly visits is the worst cell in our grid at 89.6%. Tighten to DR 60 and it drops to 85.9%. This combination deserves a hard stop, not a discount.
Treat Zero Recorded Traffic As A Decline
86 domains in our set had no recorded organic traffic at all. They indexed at 89.1% against 97.1% for sites with any traffic. There’s no price that makes that worth it.
New Site With No History? Run Ten Placements And Stop At Two Failures
Ten placements with a two failure cutoff catches a weak publisher 62.4% of the time and wrongly flags a sound one only 1.6% of the time. One failure on its own means almost nothing, since about one in five sound sites records one within ten placements at random.
Honest Limits
What This Study Does Not Prove
We’d rather you trust the parts that hold than take the whole thing on faith. Here’s where it’s thin.
- Each URL was checked once. We never went back to re-check the failures. So read the flat line in the timing section as “no evidence that waiting helps,” not as proof that waiting can’t help.
- The Ahrefs numbers were pulled in October 2026, after the placements went live. The likely story is a common cause, where weak sites both index badly and earn little traffic. That’s fine for a screen. It doesn’t establish a mechanism.
- This is one company’s vetted inventory over eight weeks. On open market inventory that nobody filtered first, Domain Rating might recover some apparent usefulness just by picking up the gross quality gaps our vetting already removed.
- 56 failures is a small number to build on. The headline findings hold up even after we account for having tested ten things at once. The finer cuts, including the DR by traffic grid with 14 failures in its weakest cell, rest on small numbers.
- The $100 threshold was picked by looking at this table on this data. Real world performance will be lower. It needs testing forward, not just backward.
- Indexation is a floor, not an outcome. Nothing here measures rankings, referral traffic or client results. An indexed page on a site nobody reads counts as a win in this analysis, and it shouldn’t count as one in your reporting.
You can explore our complete methodology and findings in the full research linked here.
Questions
What People Ask Us About This
So should I stop looking at Domain Rating entirely?
No. DR still describes a site’s backlink profile, and it’s useful for rough sorting on inventory nobody has filtered. What this data says is narrower: once a site has passed basic vetting, DR stops predicting whether your article will exist in Google’s index, and traffic value doesn’t. Stop using DR alone as the quality signal in client reporting.
My guest post isn’t indexed. Will it show up eventually?
Our data gives you no reason to expect it. Pages checked within 24 hours of going live were indexed 98.4% of the time, and pages checked two to three weeks later were at 97.5%. The line is flat. If it isn’t in the index when you check, the site is the more likely explanation than the clock. We are running a follow up study that re-checks failures at 7, 30 and 90 days to answer this properly.
Does writing a better article improve my odds?
Not for indexation, at least not within the quality band this inventory represents. Topic, YMYL status, fit to the host site and URL structure all came back empty. That doesn’t make the editorial work pointless, because nothing here measures whether a link moved rankings or sent traffic. It does mean that if your indexation rate is the problem, your site list is where to look, not your briefs.
Can I place health or finance content safely?
We do it every week, and those placements indexed at 95.8% against 96.4% for everything else. But that number comes with the policy attached. We build the topic so the premise sits away from clinical, diagnostic and advisory ground, even when the client’s keyword is firmly in a regulated sector. We can’t tell you from this data what a hard medical advice article would have done, because we never placed one to find out.
Why does a placement take 16 days?
Because it’s a chain of human steps, not a technical process. Outreach, acceptance, the article getting written, approvals, and then the site owner’s own calendar, which often has posts already scheduled ahead of yours. The spread clusters at day 11 and again around days 19 to 21, which is the shape of publishing schedules rather than of anything Google does. Google’s part of the wait is measured in hours. If you’re setting client expectations, three weeks covers 84.8% of placements and two weeks covers 45.4%.
Work With Us
Want To See The Traffic Value Before You Approve A Site?
Every placement we propose comes to you for approval before a single email goes out. Bring this screen to the next one and tell us where to set your floor.
Based on 1,544 guest post placements across 412 publisher domains, delivered 11 August to 6 October 2026. Publisher metrics from Ahrefs, pulled October 2026. Full methodology, every statistical test and all appendix tables are in the complete research report.

Dileep Thekkethil
AuthorDileep Thekkethil is the Director of Marketing at Stan Ventures and an SEMRush certified SEO expert. With over a decade of experience in digital marketing, Dileep has played a pivotal role in helping global brands and agencies enhance their online visibility. His work has been featured in leading industry platforms such as MarketingProfs, Search Engine Roundtable, and CMSWire, and his expert insights have been cited in Google Videos. Known for turning complex SEO strategies into actionable solutions, Dileep continues to be a trusted authority in the SEO community, sharing knowledge that drives meaningful results.