Most people chasing a “Google recommended page load time” are looking for one number to hit. They run a test, see a green score, and assume the job is done, yet they still can’t say what load time they’re actually supposed to aim for, or why two tools give them two different answers.
The honest version is more useful than a single number. Google’s long-standing rule of thumb is that a page should become usable in under three seconds, but the search engine no longer measures experience with a stopwatch. It measures it with a small set of real-world metrics built around how a page feels to the person using it. Understanding the difference is what separates a page that merely scores well from one that actually keeps visitors and earns rankings.
This guide lays out the benchmark Google points to, the metrics that replaced the old “seconds to load” framing, what the data says a good page load time looks like, and how to measure and reach it.
The Page Load Time Google Actually Recommends
The most-quoted figure is straightforward: aim for a page that loads in under three seconds, and ideally closer to two. That benchmark has held up for years because it depends on how people behave. Visitors expect a page to be ready almost immediately, and patience drops sharply with every additional second.
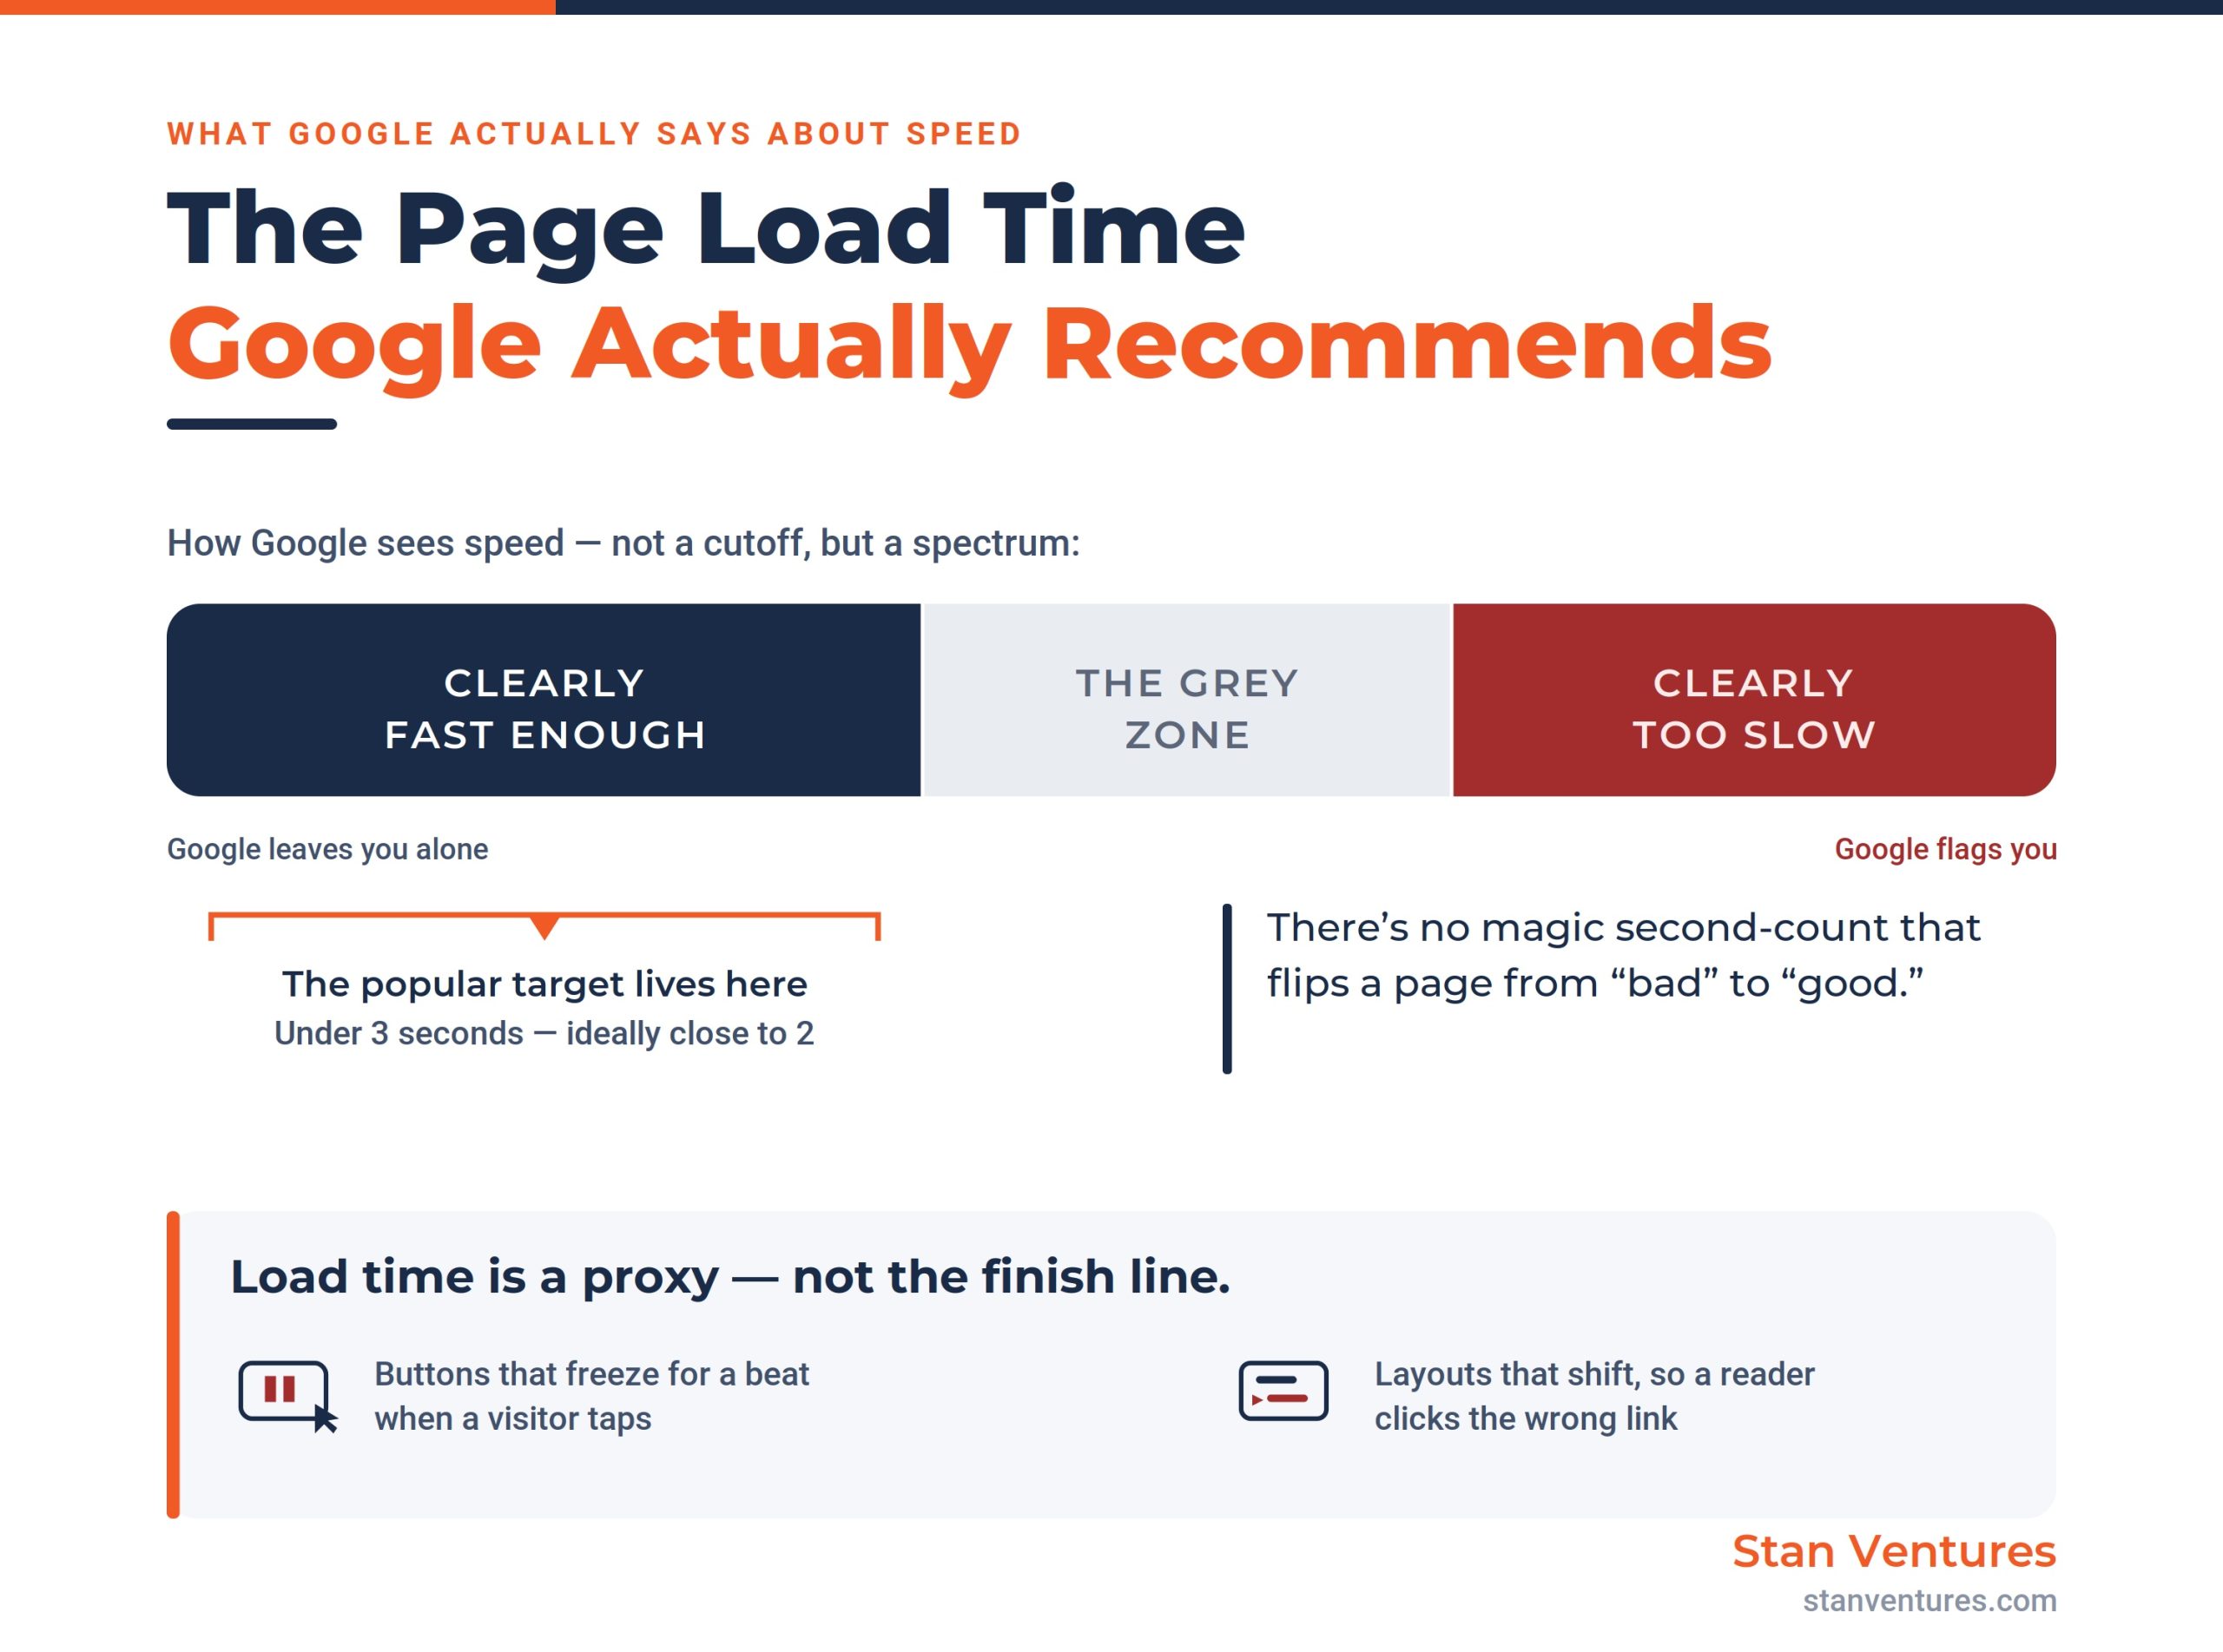
The complication is that Google has deliberately moved away from endorsing a single threshold. Google’s Martin Splitt has described the search engine’s view of speed less as a precise cutoff and more as a broad distinction between pages that are clearly fast enough and pages that are clearly too slow, with a wide grey zone in between. In other words, there is no magic second-count that flips a page from “bad” to “good” in the eyes of the algorithm.
That reframing matters because raw load time is a blunt instrument. A page can report a quick overall load while still freezing for two seconds when a user tries to tap a button, or shifting its layout so a reader clicks the wrong link.
“Seconds to load” misses both of those experiences entirely. So while under-three-seconds remains a sound target, it’s best treated as a proxy for the metrics Google actually evaluates, not the finish line itself.
The Benchmarks That Replaced the Stopwatch
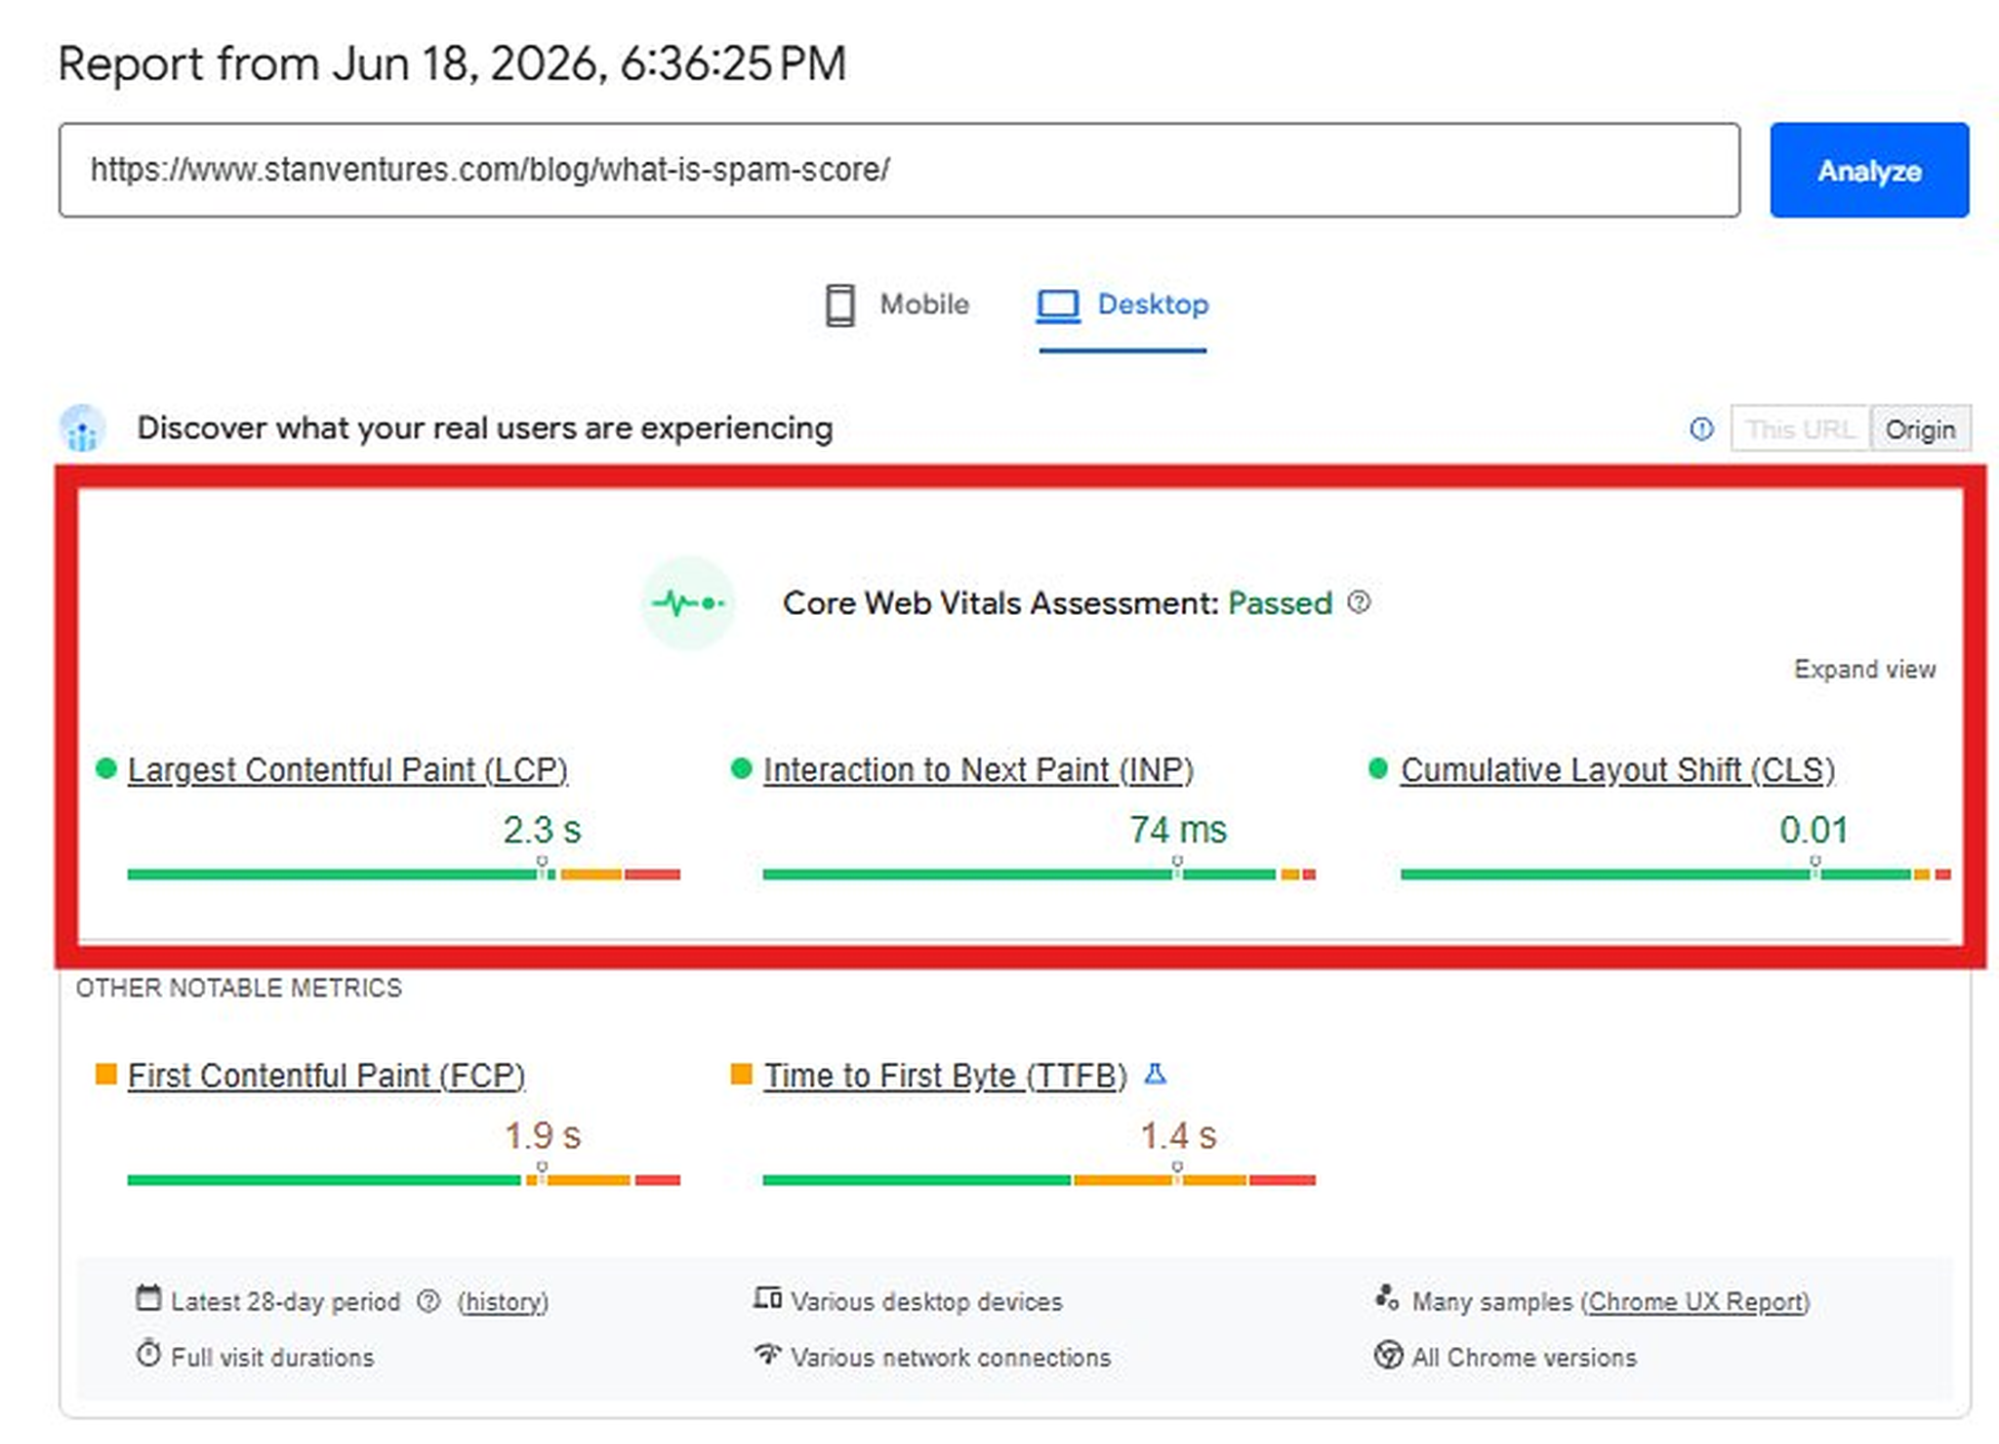
The modern, precise version of “Google recommended page load time” lives in Core Web Vitals: three field metrics Google uses to quantify loading, responsiveness, and visual stability. Each has a published “good” threshold, and Google evaluates them at the 75th percentile of real visits, meaning at least three out of four page views need to clear the bar.
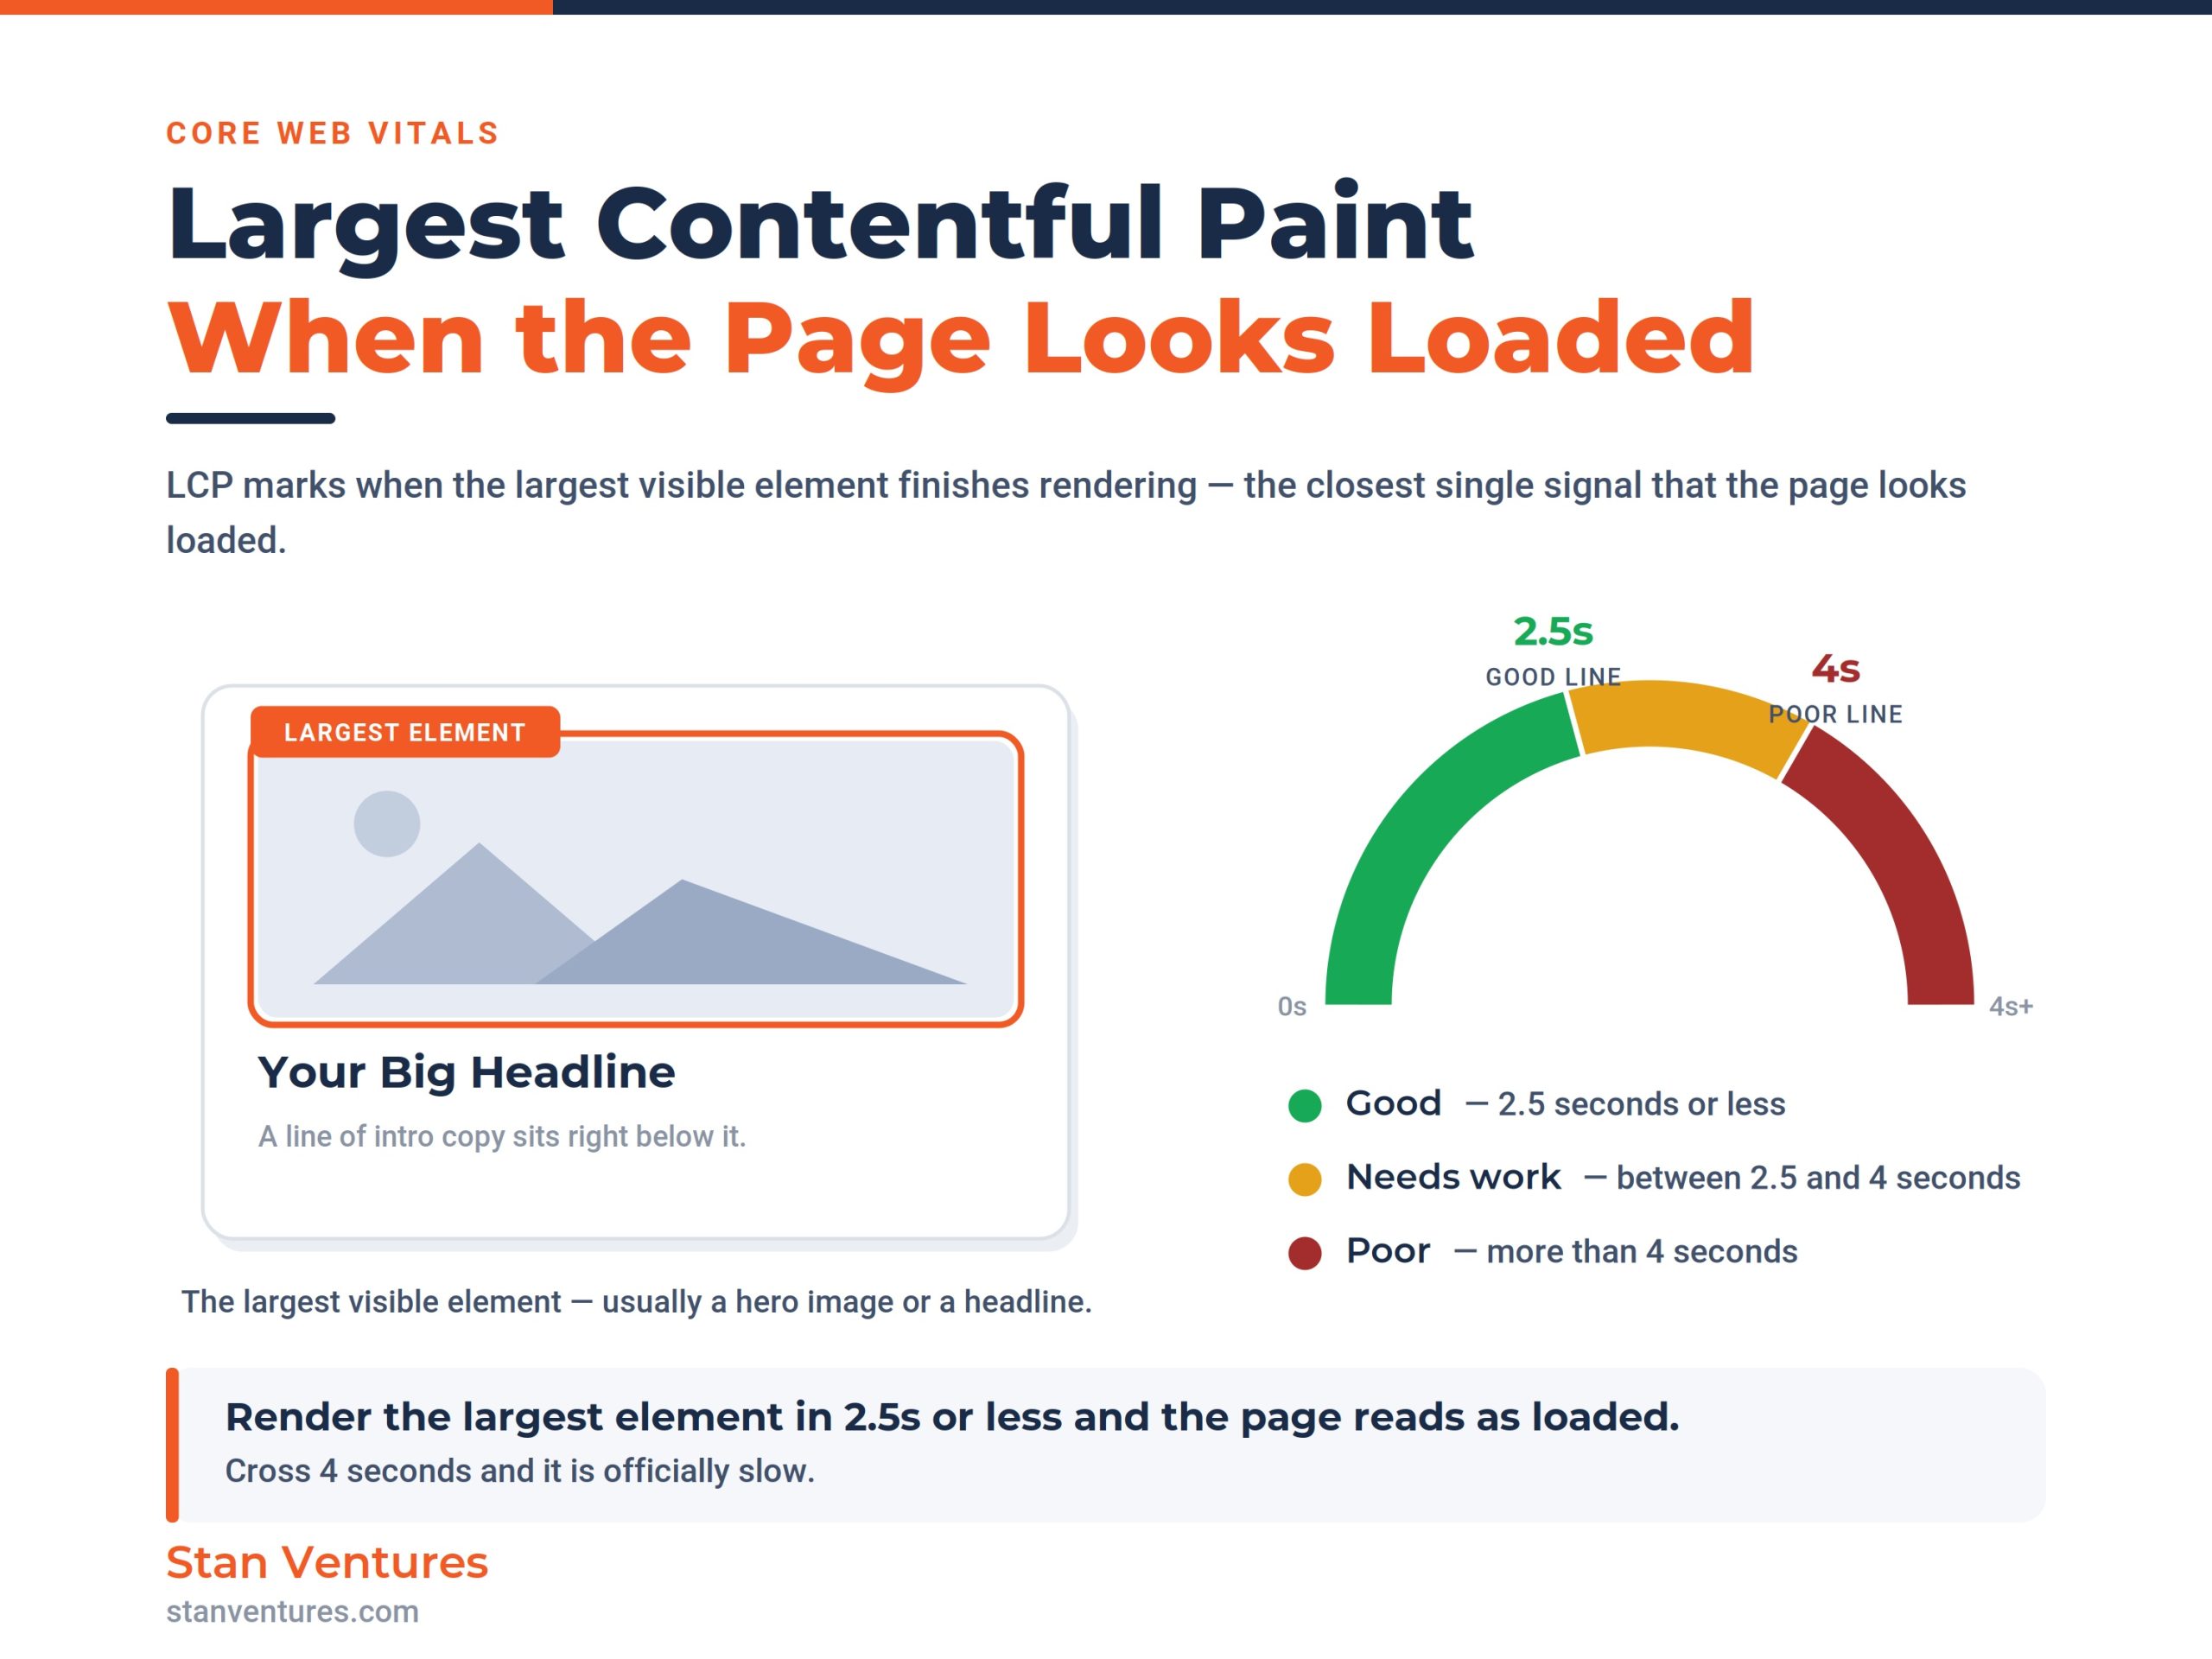
Largest Contentful Paint (LCP) measures loading. It marks the moment the largest visible element, usually a hero image or headline, finishes rendering, which is the closest single metric to “the page looks loaded.” A good Largest Contentful Paint is 2.5 seconds or less; above 4 seconds is poor.
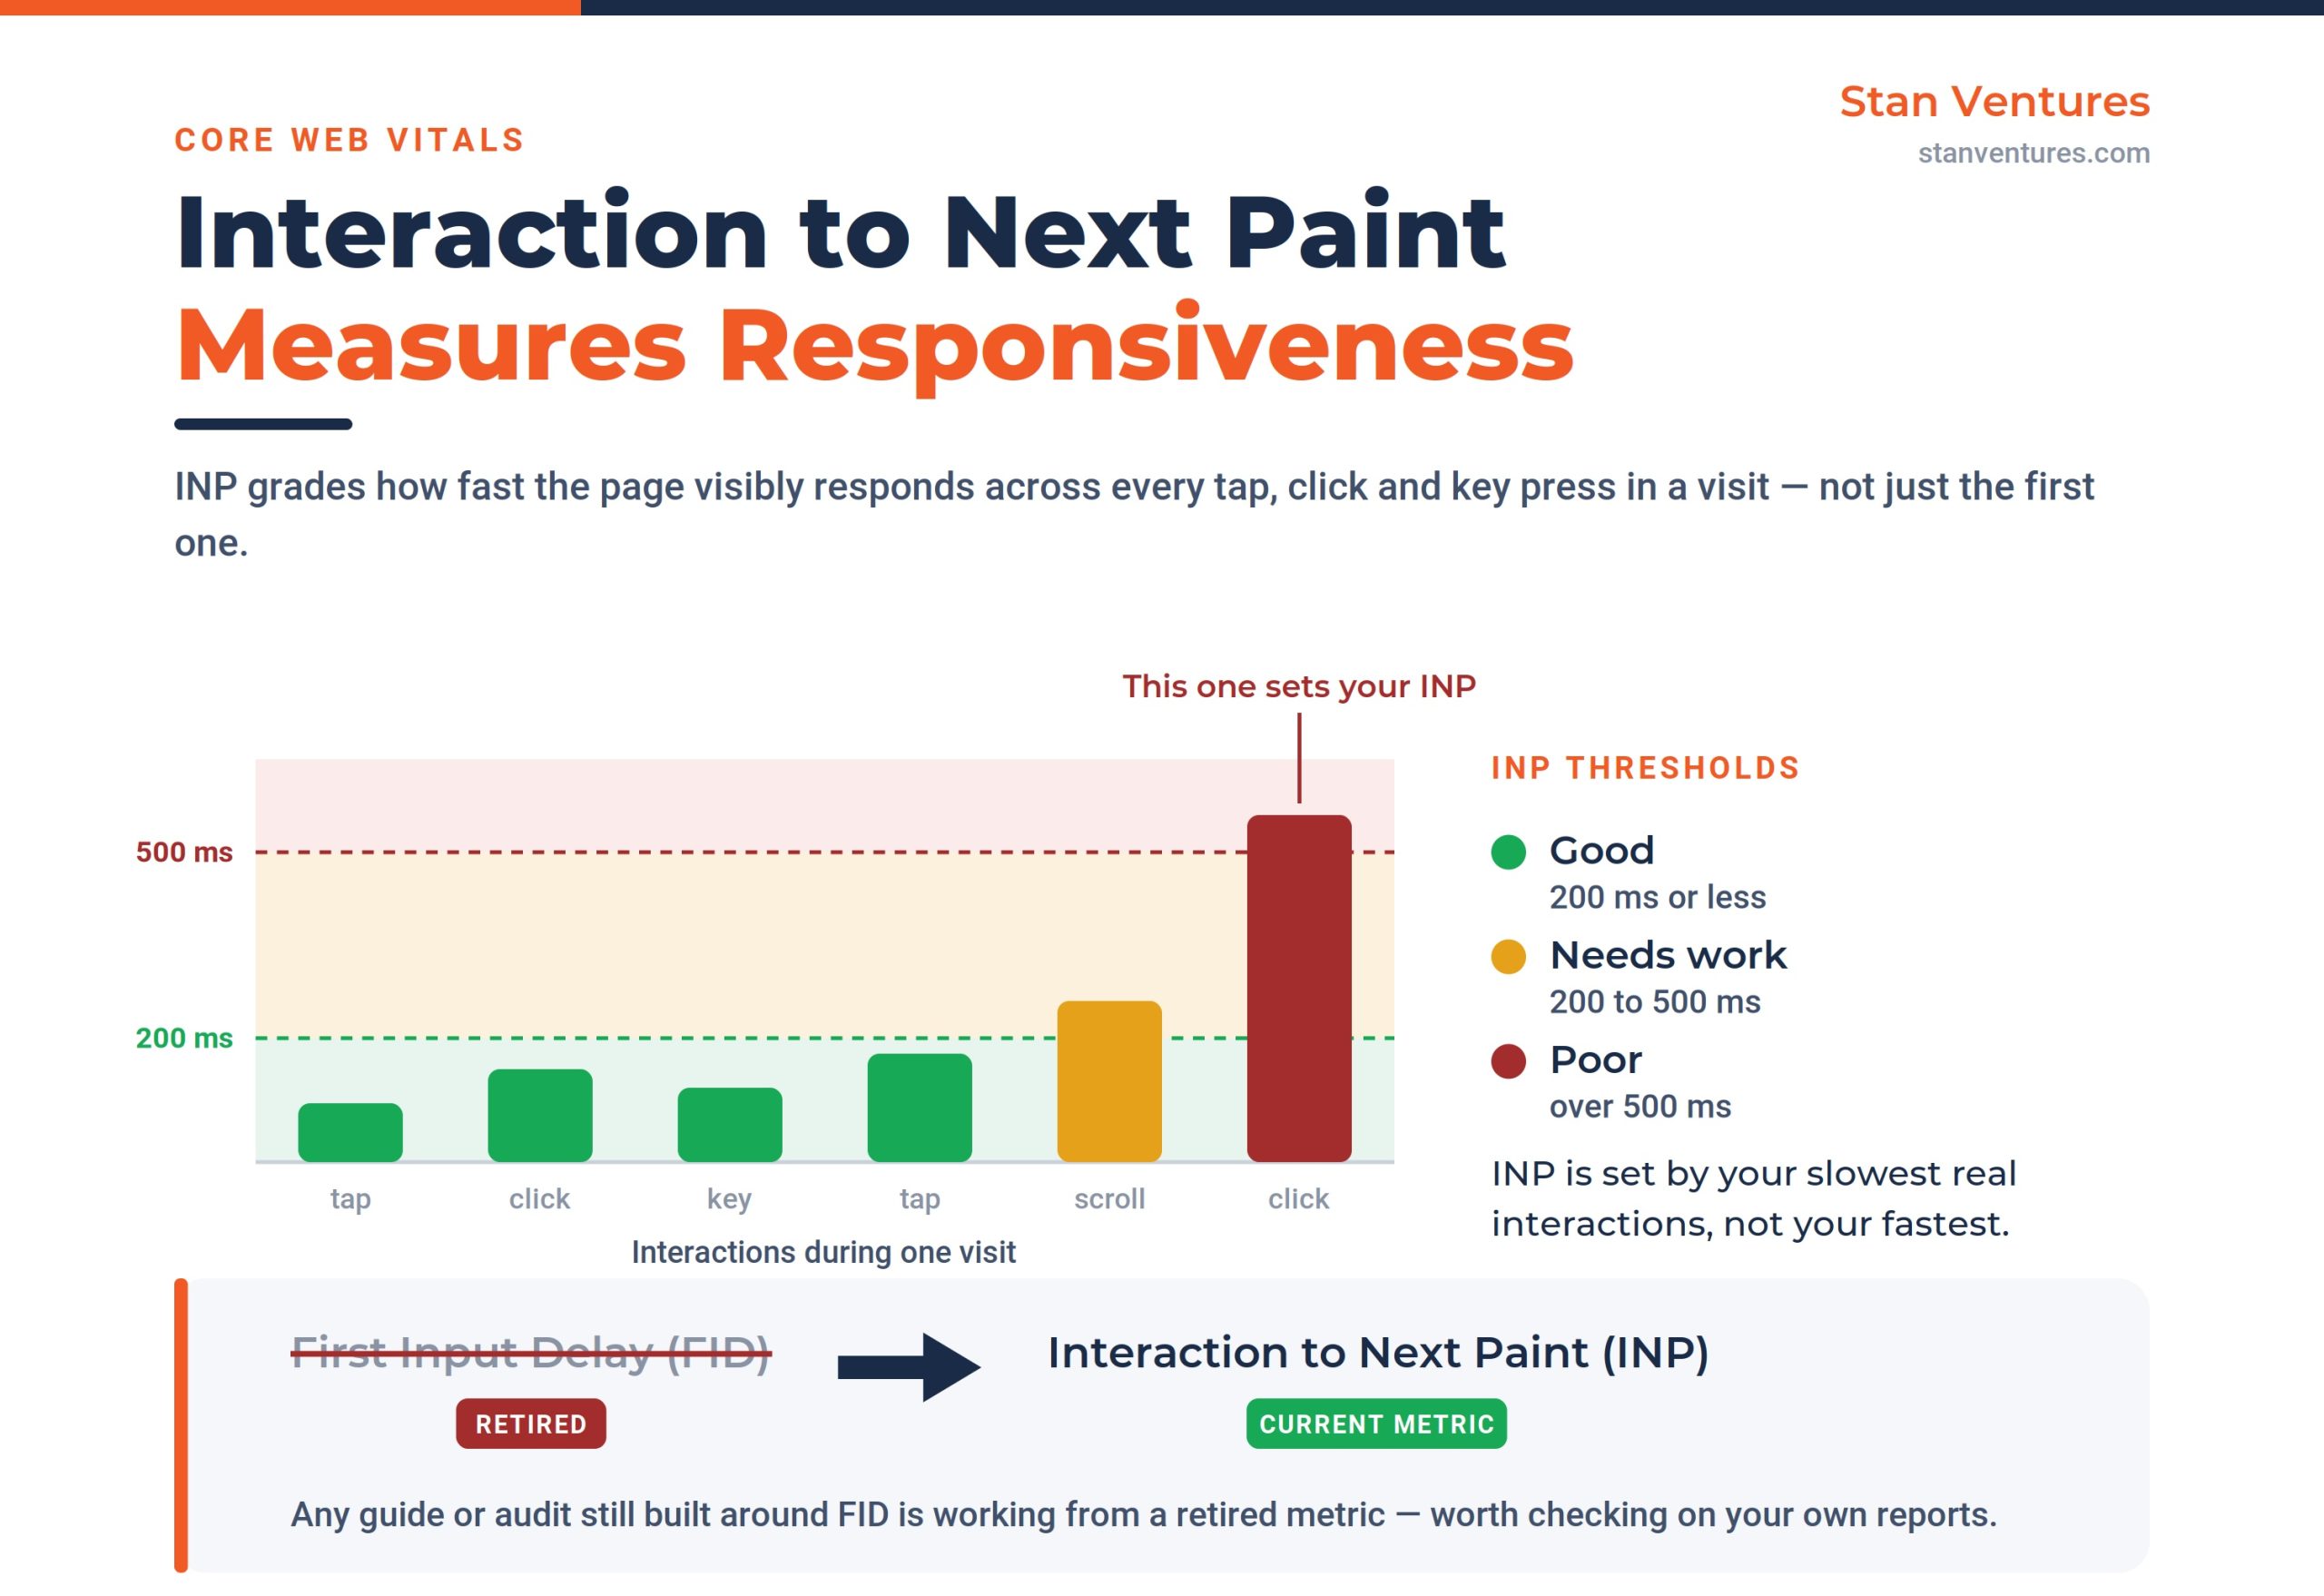
Interaction to Next Paint (INP) measures responsiveness. It tracks how quickly the page visibly responds across all of a user’s taps, clicks, and key presses during a visit. A good INP is 200 milliseconds or less, 200-500ms needs improvement, and anything over 500ms is poor.
This is the metric most people get wrong in 2026, because INP officially replaced First Input Delay (FID) as a Core Web Vital on March 12, 2024. Any guide or audit still built around FID is working from a retired metric, a detail worth checking on your own reports.
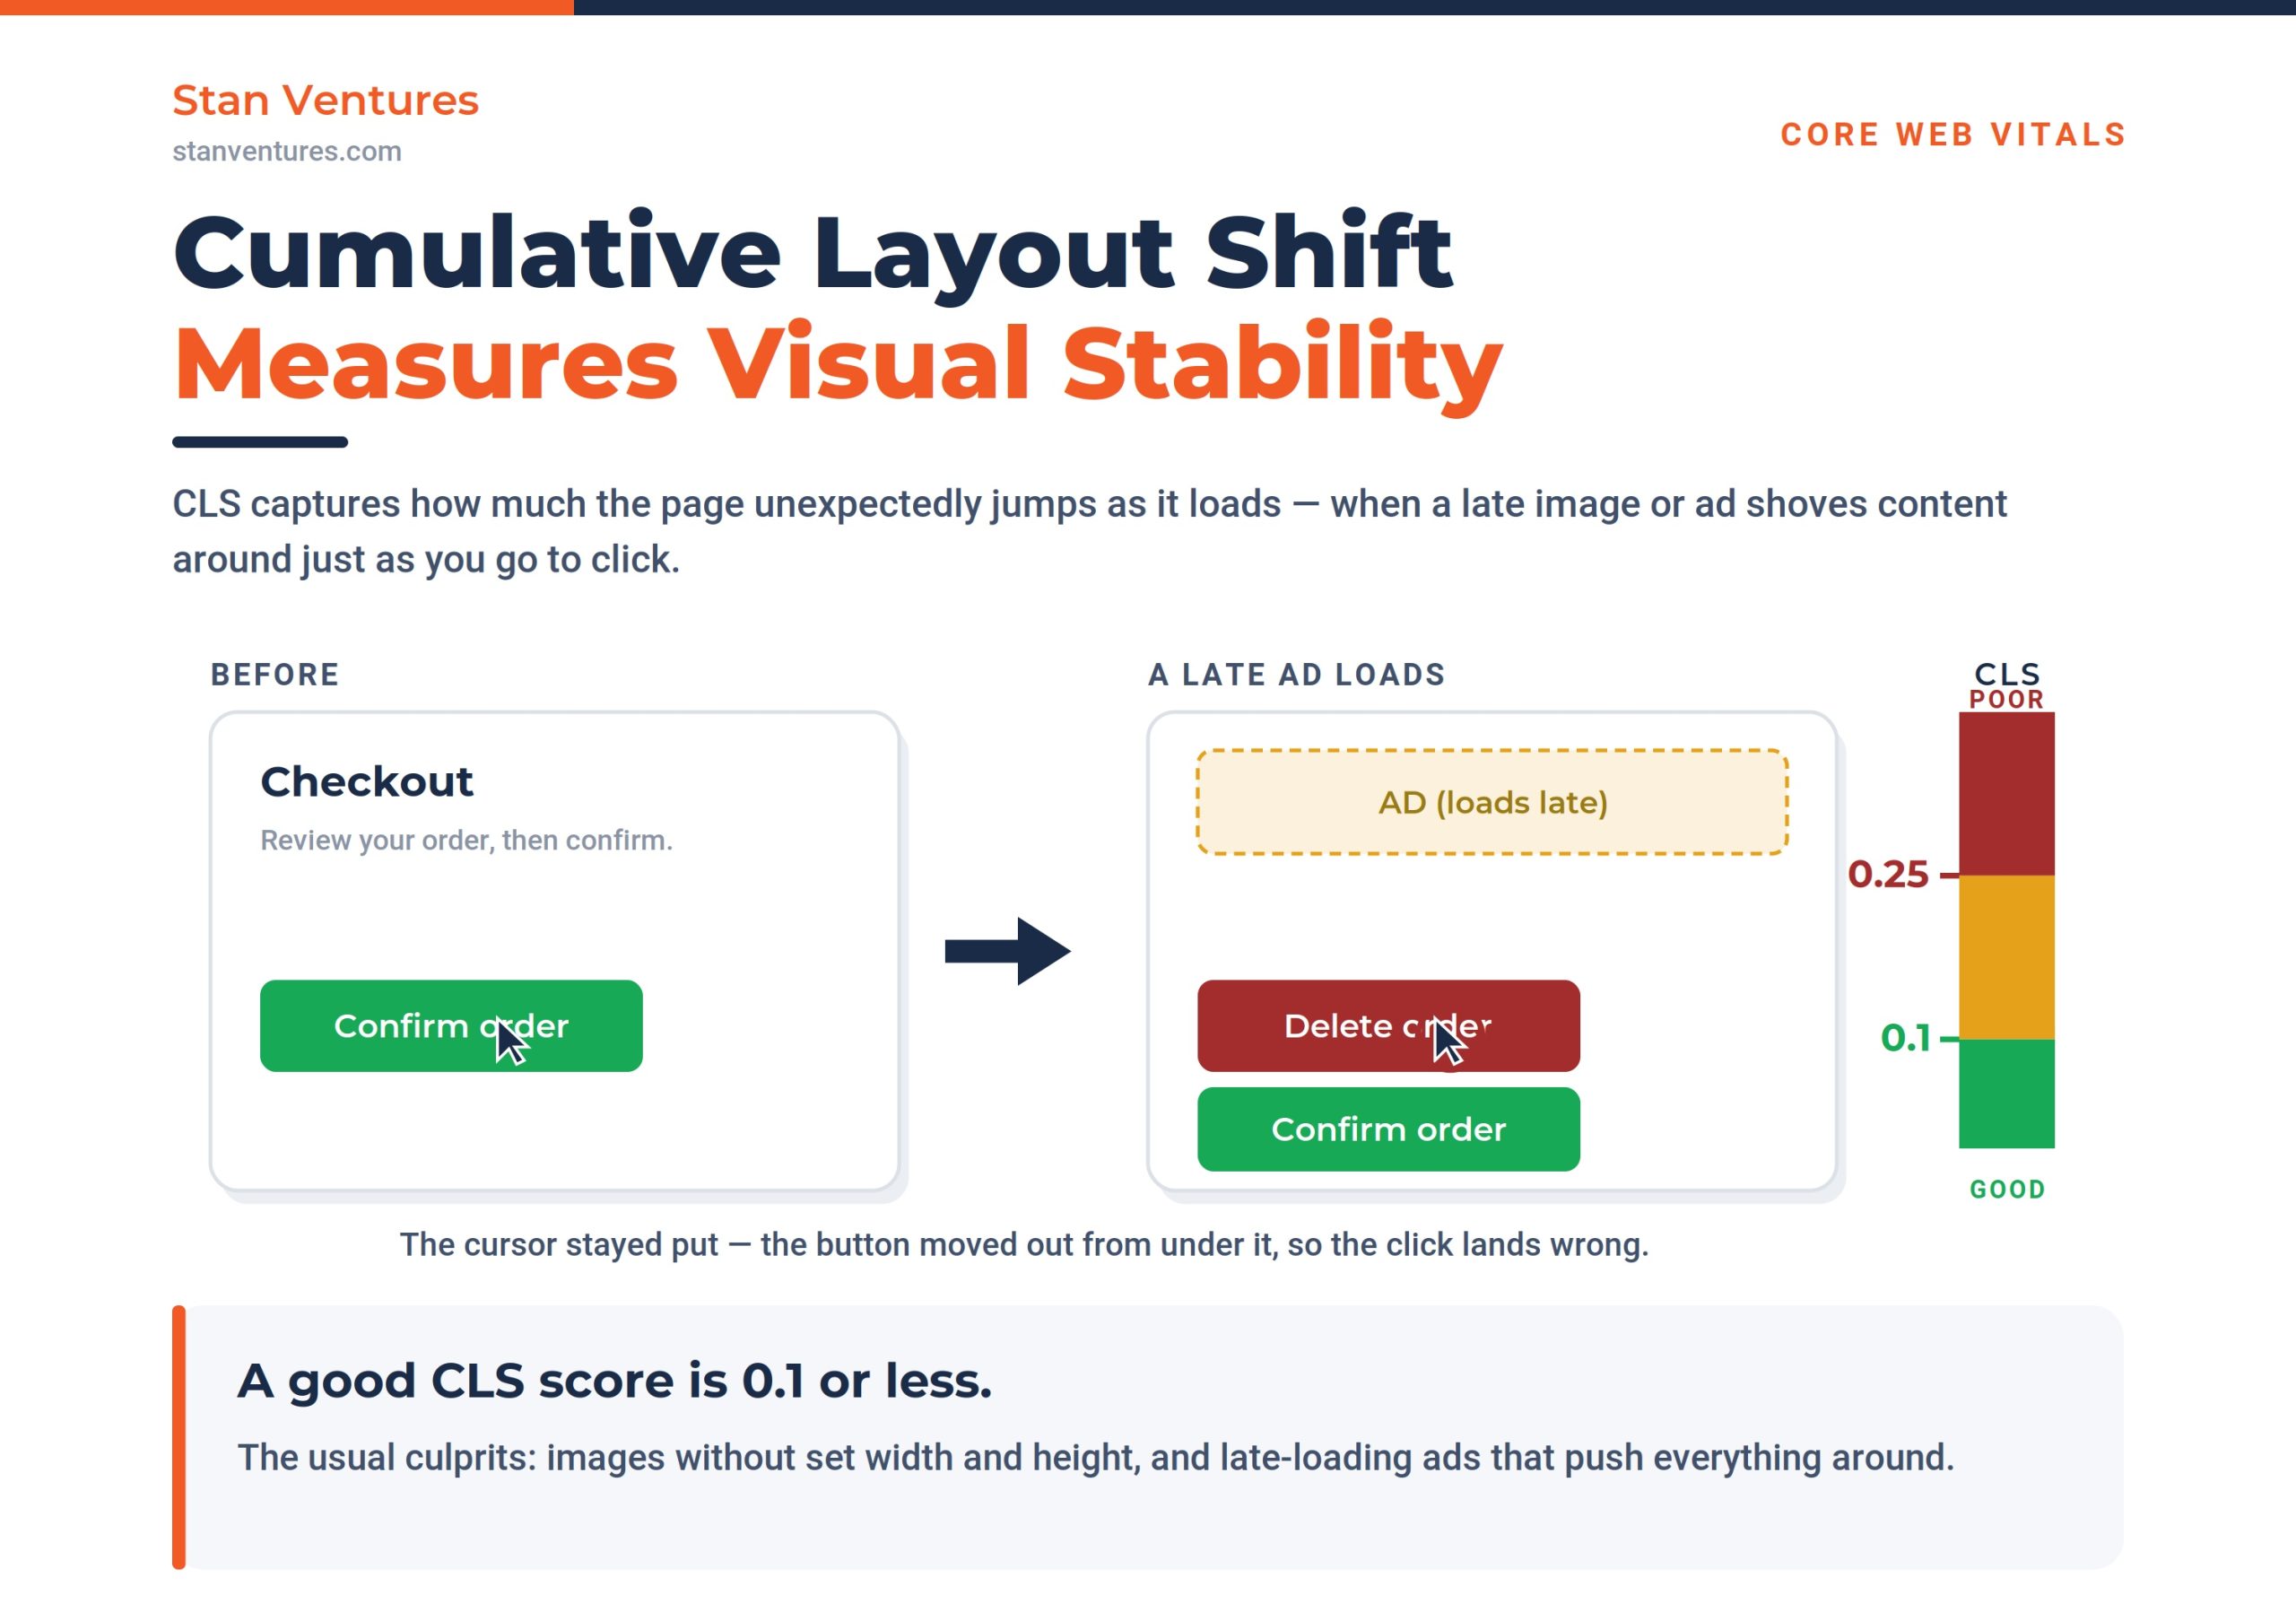
Cumulative Layout Shift (CLS) measures visual stability. It captures how much the page unexpectedly shifts as it loads: the jump that happens when an image without set dimensions or a late-loading ad pushes content around. A good Cumulative Layout Shift score is 0.1 or less. The full thresholds are documented in Google’s own Web Vitals reference.
These three are the benchmark that matters most, because they’re the version of “fast” Google can actually measure from real Chrome users rather than a lab simulation.
What a Good Page Load Time Looks Like by the Numbers
Stepping back from the metric names, here is what the data says about load time in plain seconds. Independent analyses, including Backlinko’s study of search results, have put the average load time of a first-page Google result at under two seconds, while the typical site across the web lands closer to three. The gap between those two figures is roughly the competitive advantage that speed buys.
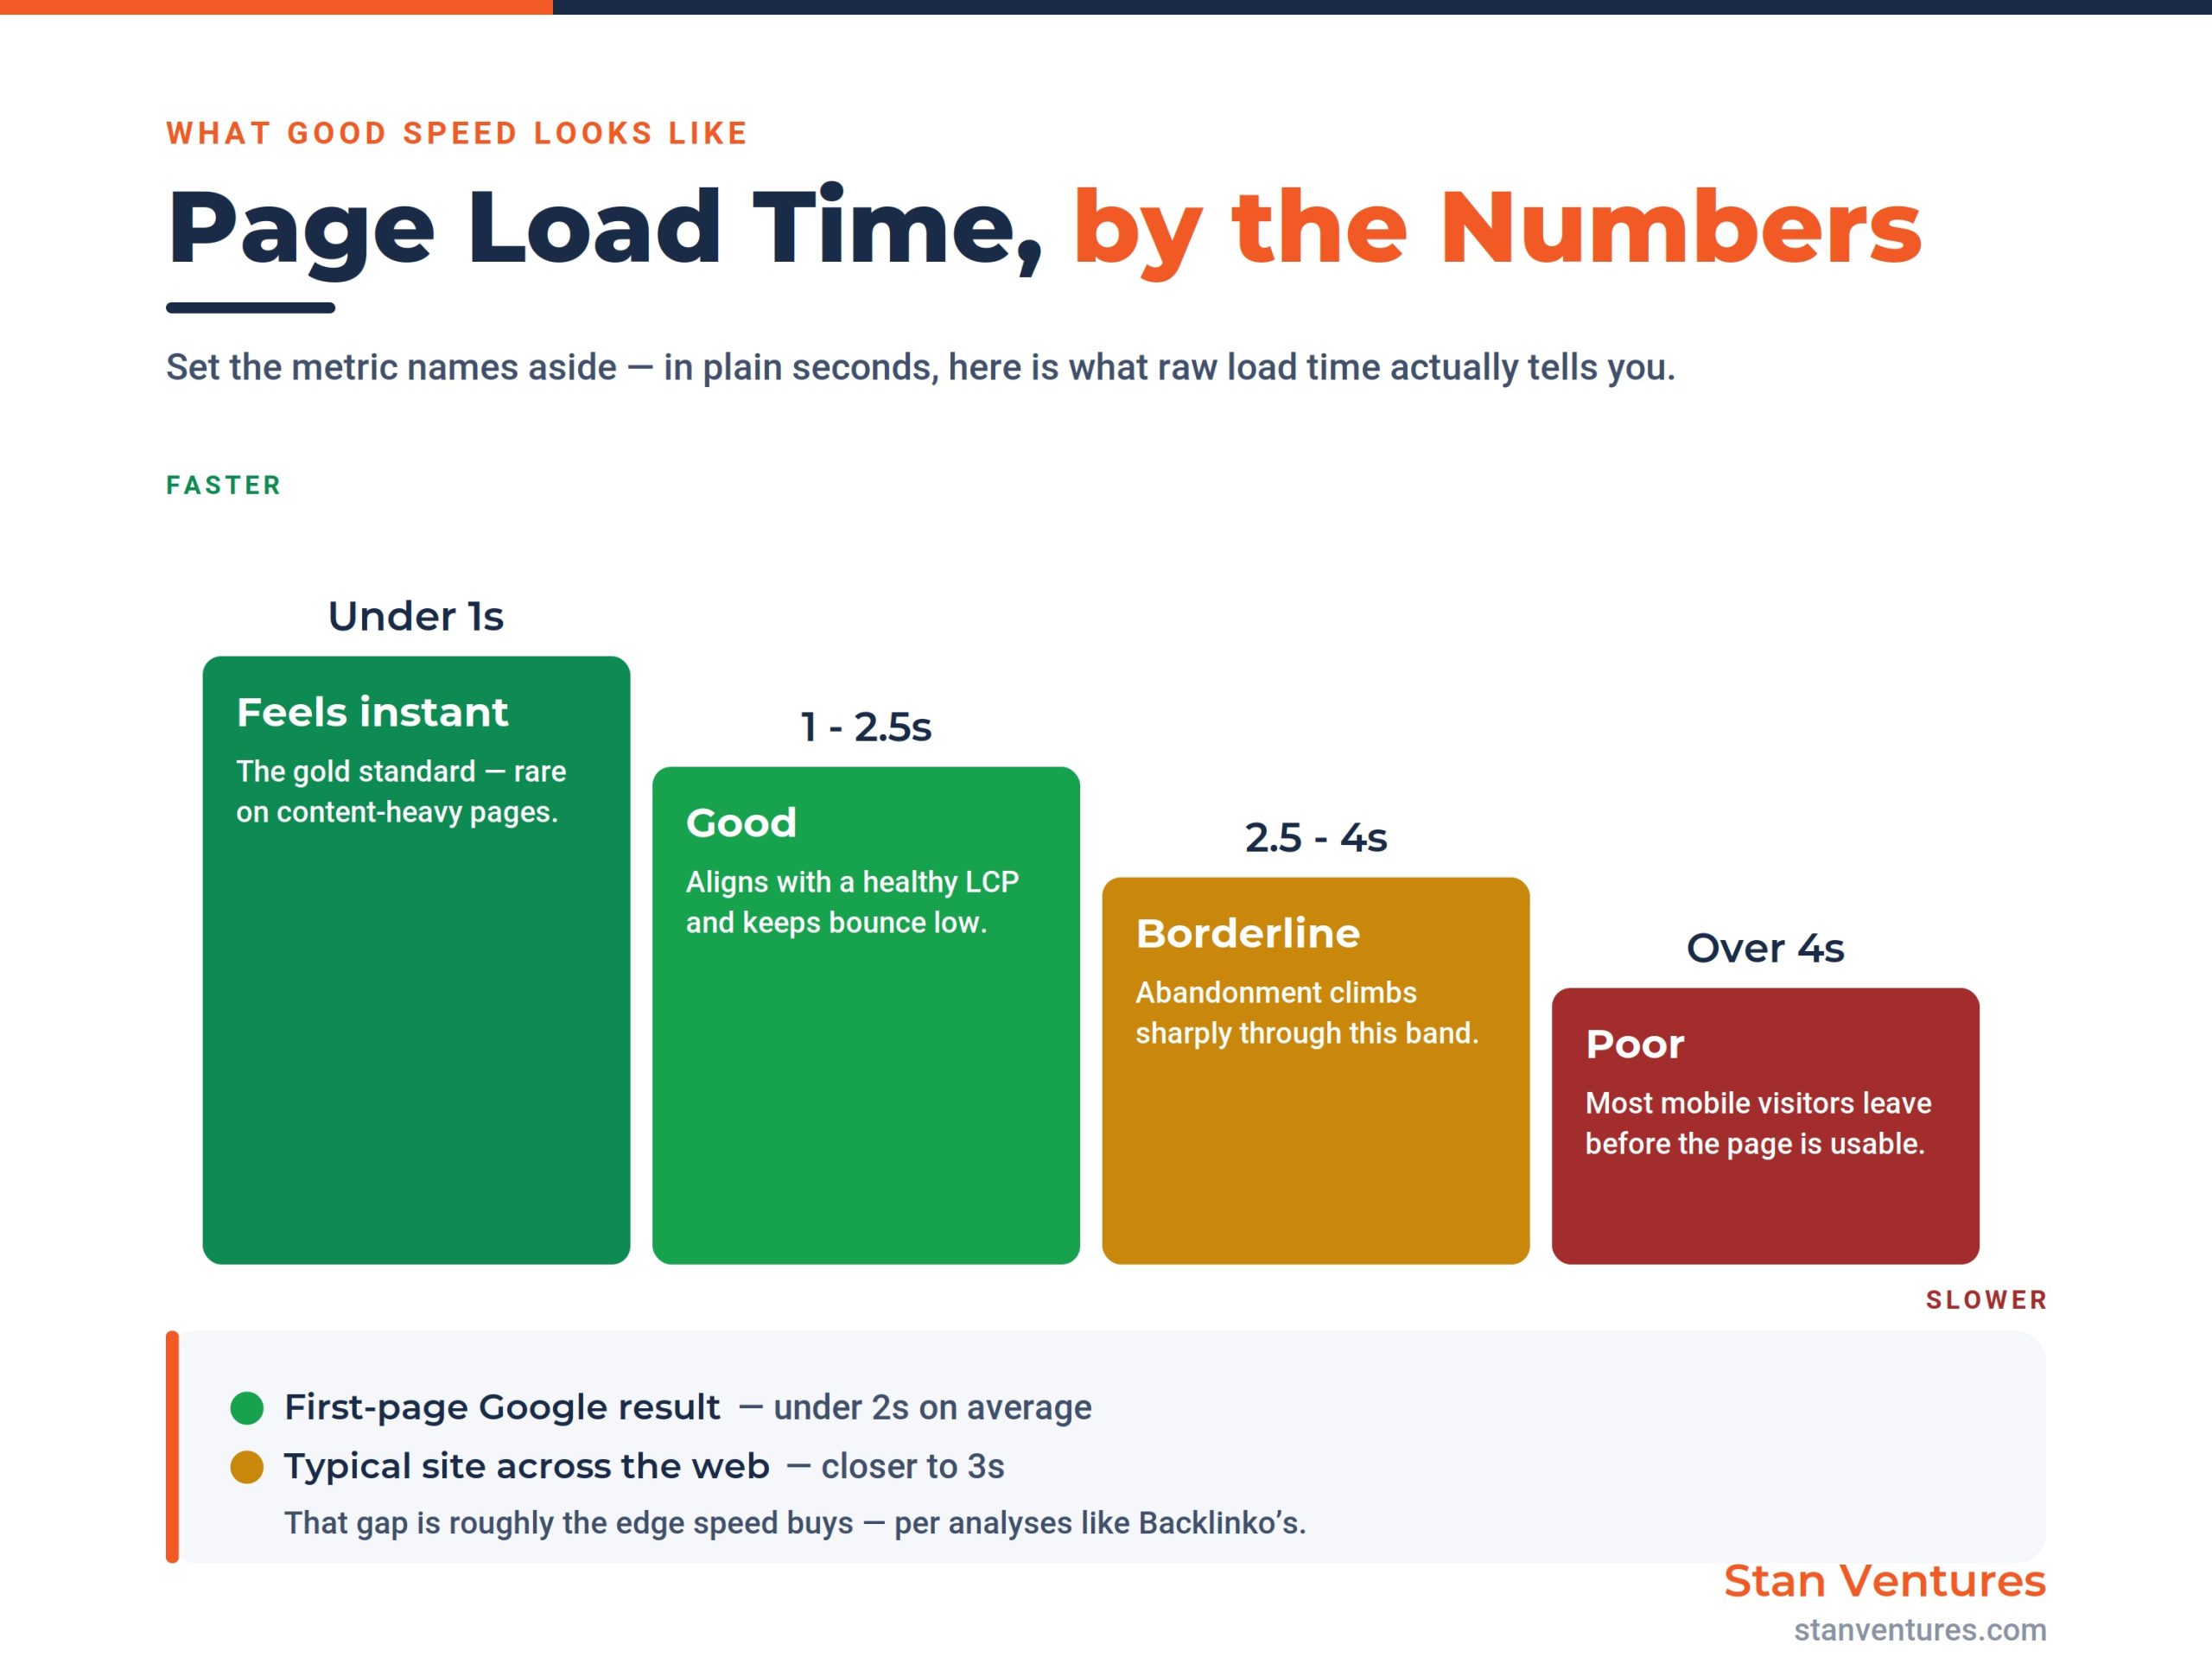
Two caveats keep this honest. First, these are practical guideposts, not a Google specification: the algorithm reads Core Web Vitals, not a single second-count. Second, the right target depends on the page’s job. A transactional page like checkout or a product listing deserves the most aggressive optimization, because the traffic landing there is closest to converting and least tolerant of delay.
Why the Benchmark Matters: Bounce, Conversions, and Revenue
The reason Google cares about speed is the same reason a business should: slow pages quietly bleed visitors and revenue, and the losses compound.
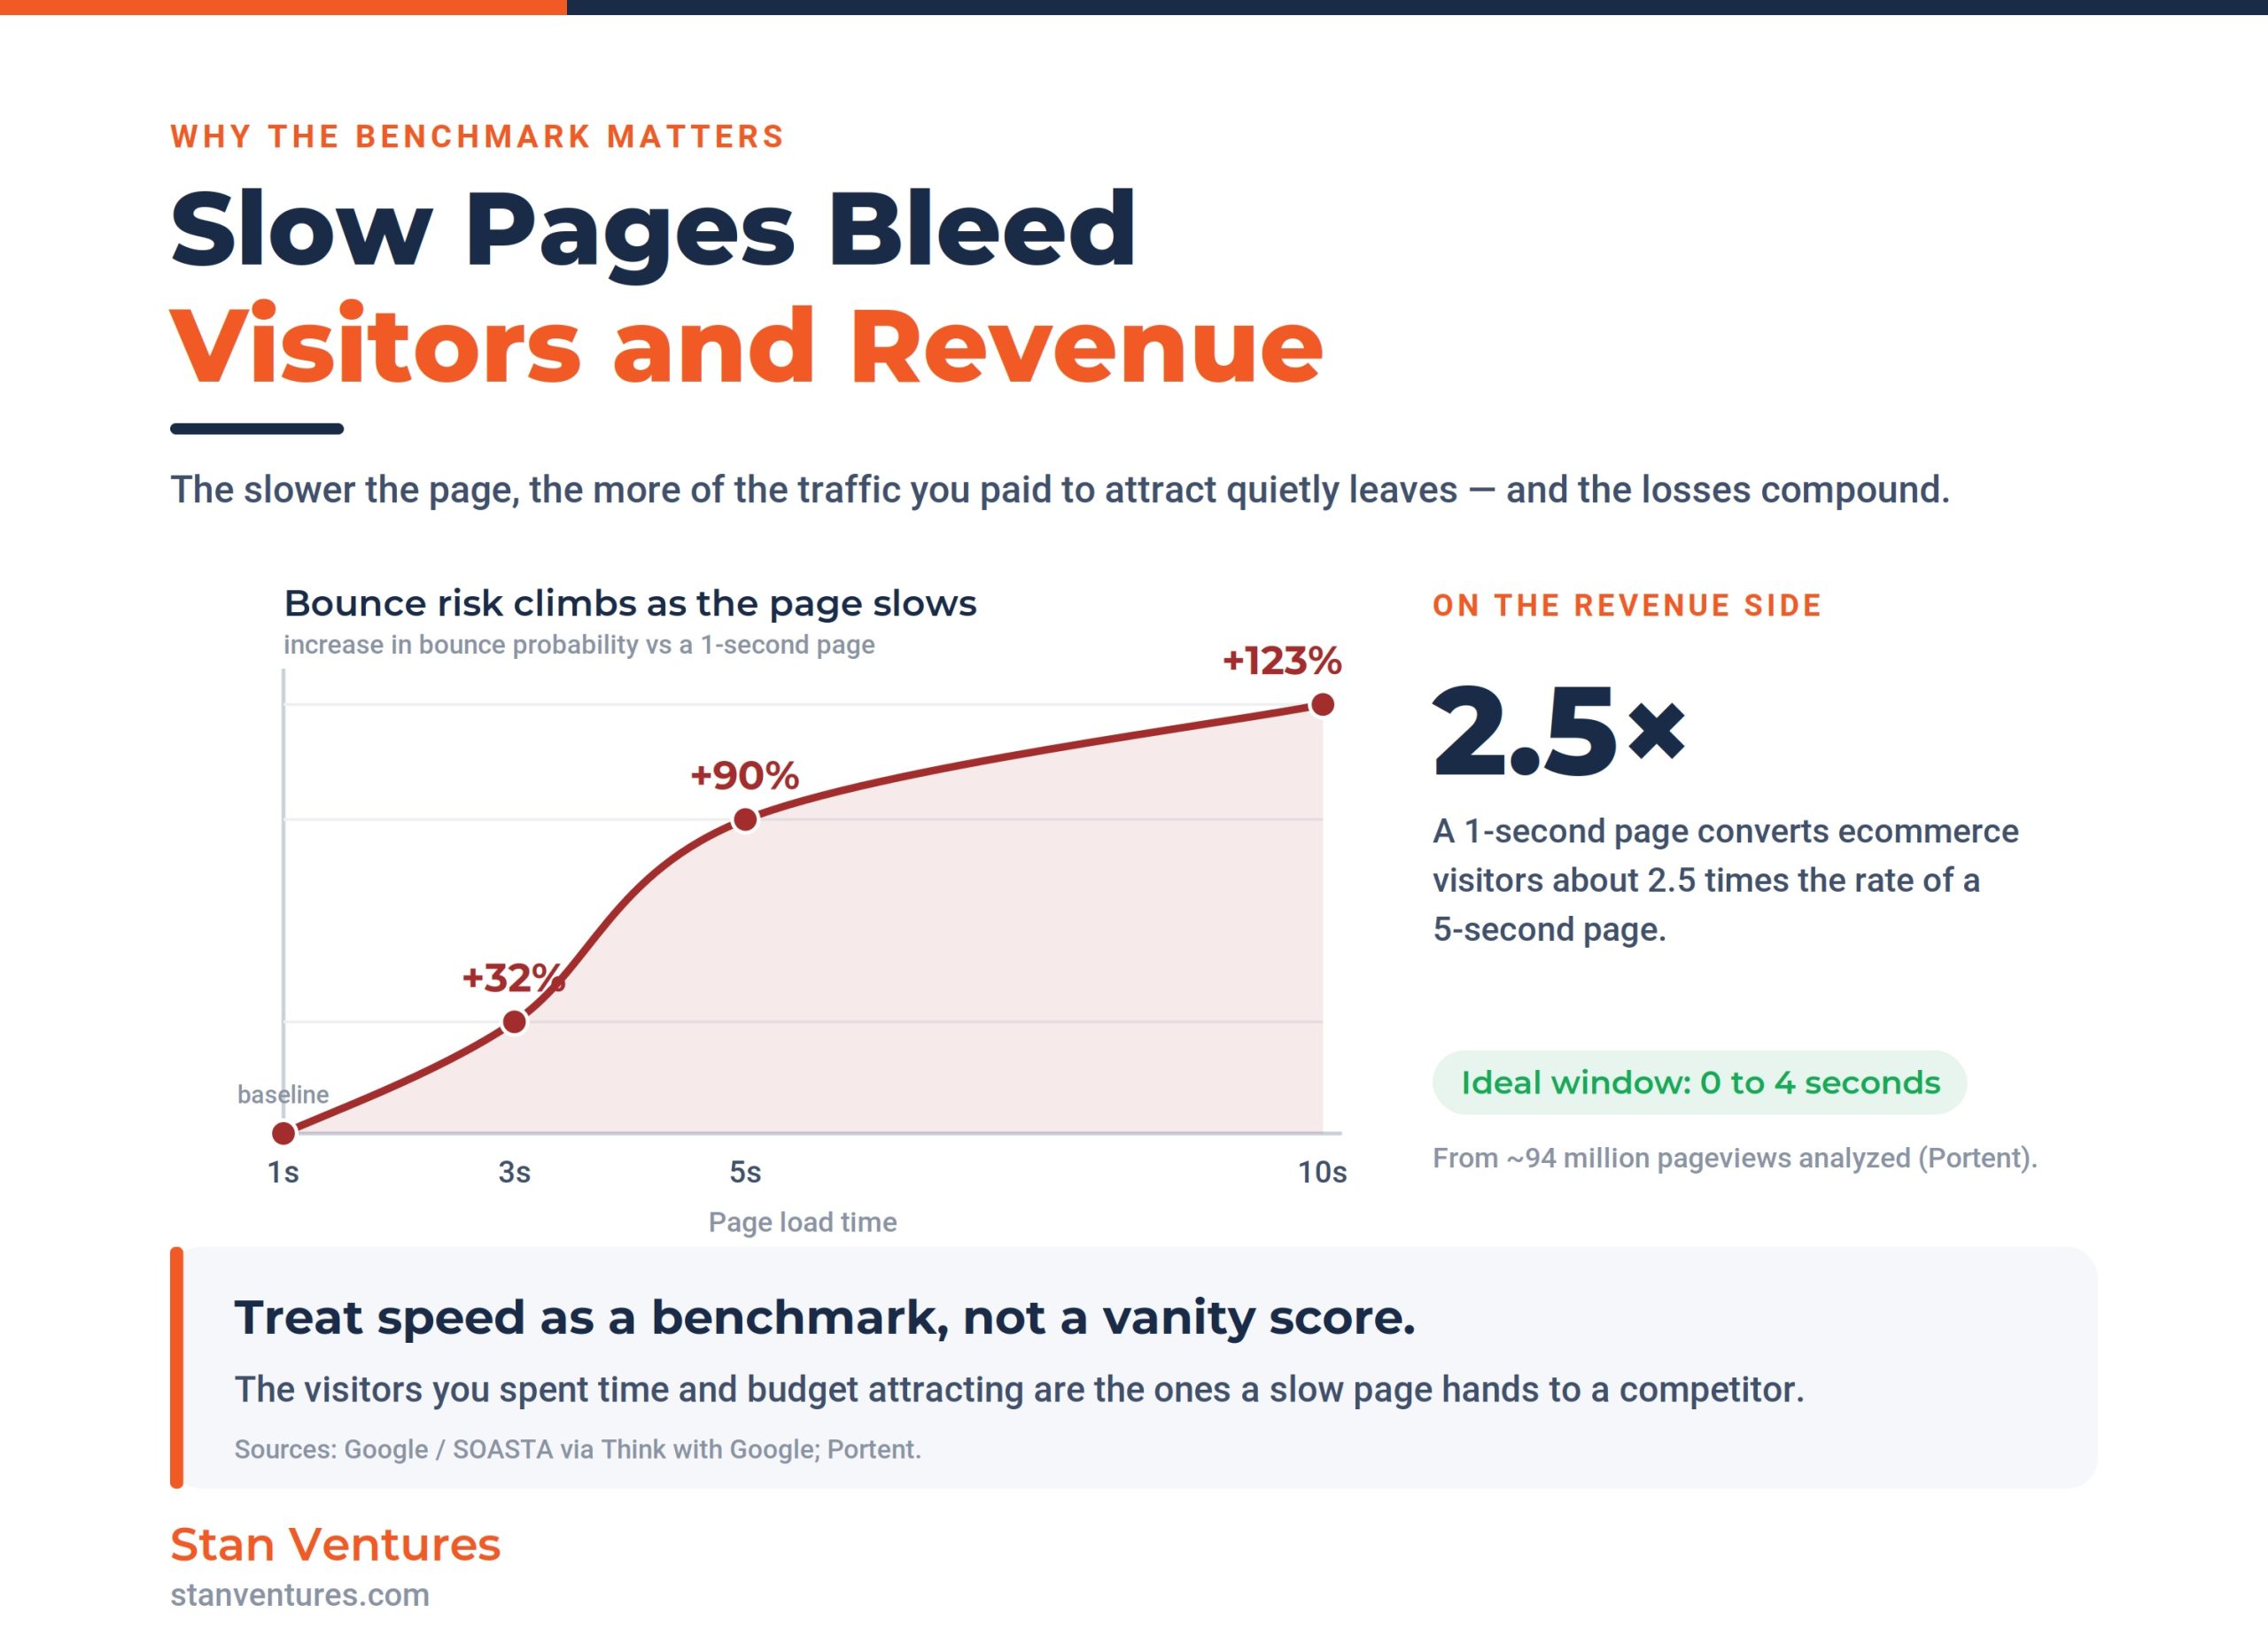
On the engagement side, Google’s research with mobile-page-speed benchmarks found that the probability of a visitor bouncing rises 32% as load time goes from one to three seconds, 90% from one to five seconds, and 123% from one to ten seconds (Google/SOASTA Research, published via Think with Google). The curve isn’t linear; it gets steeper the longer the wait.
On the revenue side, the pattern is just as clear. Portent’s analysis of roughly 94 million pageviews across B2B and B2C sites found that a page loading in one second converts ecommerce visitors at about 2.5 times the rate of a page loading in five seconds, with the ideal window sitting between zero and four seconds. For a store doing meaningful volume, a one-second improvement is rarely a cosmetic gain; it’s a line on the revenue statement.
This is the practical case for treating page load time as a benchmark rather than a vanity score: the people you spent time and budget attracting are the ones a slow page sends to a competitor.
How Page Load Time Fits Into Google Rankings
Page speed and Core Web Vitals influence rankings, but they are far smaller factors than the surrounding hype suggested, and Google has formally clarified their status.
In April 2023, Google removed “page experience,” “page speed,” “mobile-friendly,” and “secure sites” from its list of ranking systems and reclassified them as ranking signals. There is no single combined “page experience” score; these are individual signals the core ranking systems consider, not a standalone algorithm. Google later removed the Page Experience report from Search Console entirely, folding the useful data into the Core Web Vitals and HTTPS reports.
Google’s own search advocates have been blunt about the weight involved. The consistent message is that Core Web Vitals are not a major ranking factor, and that obsessing over a perfect score is a poor use of effort when content and relevance carry far more weight. Where speed genuinely earns its keep is as a tiebreaker: when two pages answer a query about equally well, the one that delivers a smoother experience can edge ahead. Google itself has noted it will still surface the most relevant content even when the page experience is sub-par.
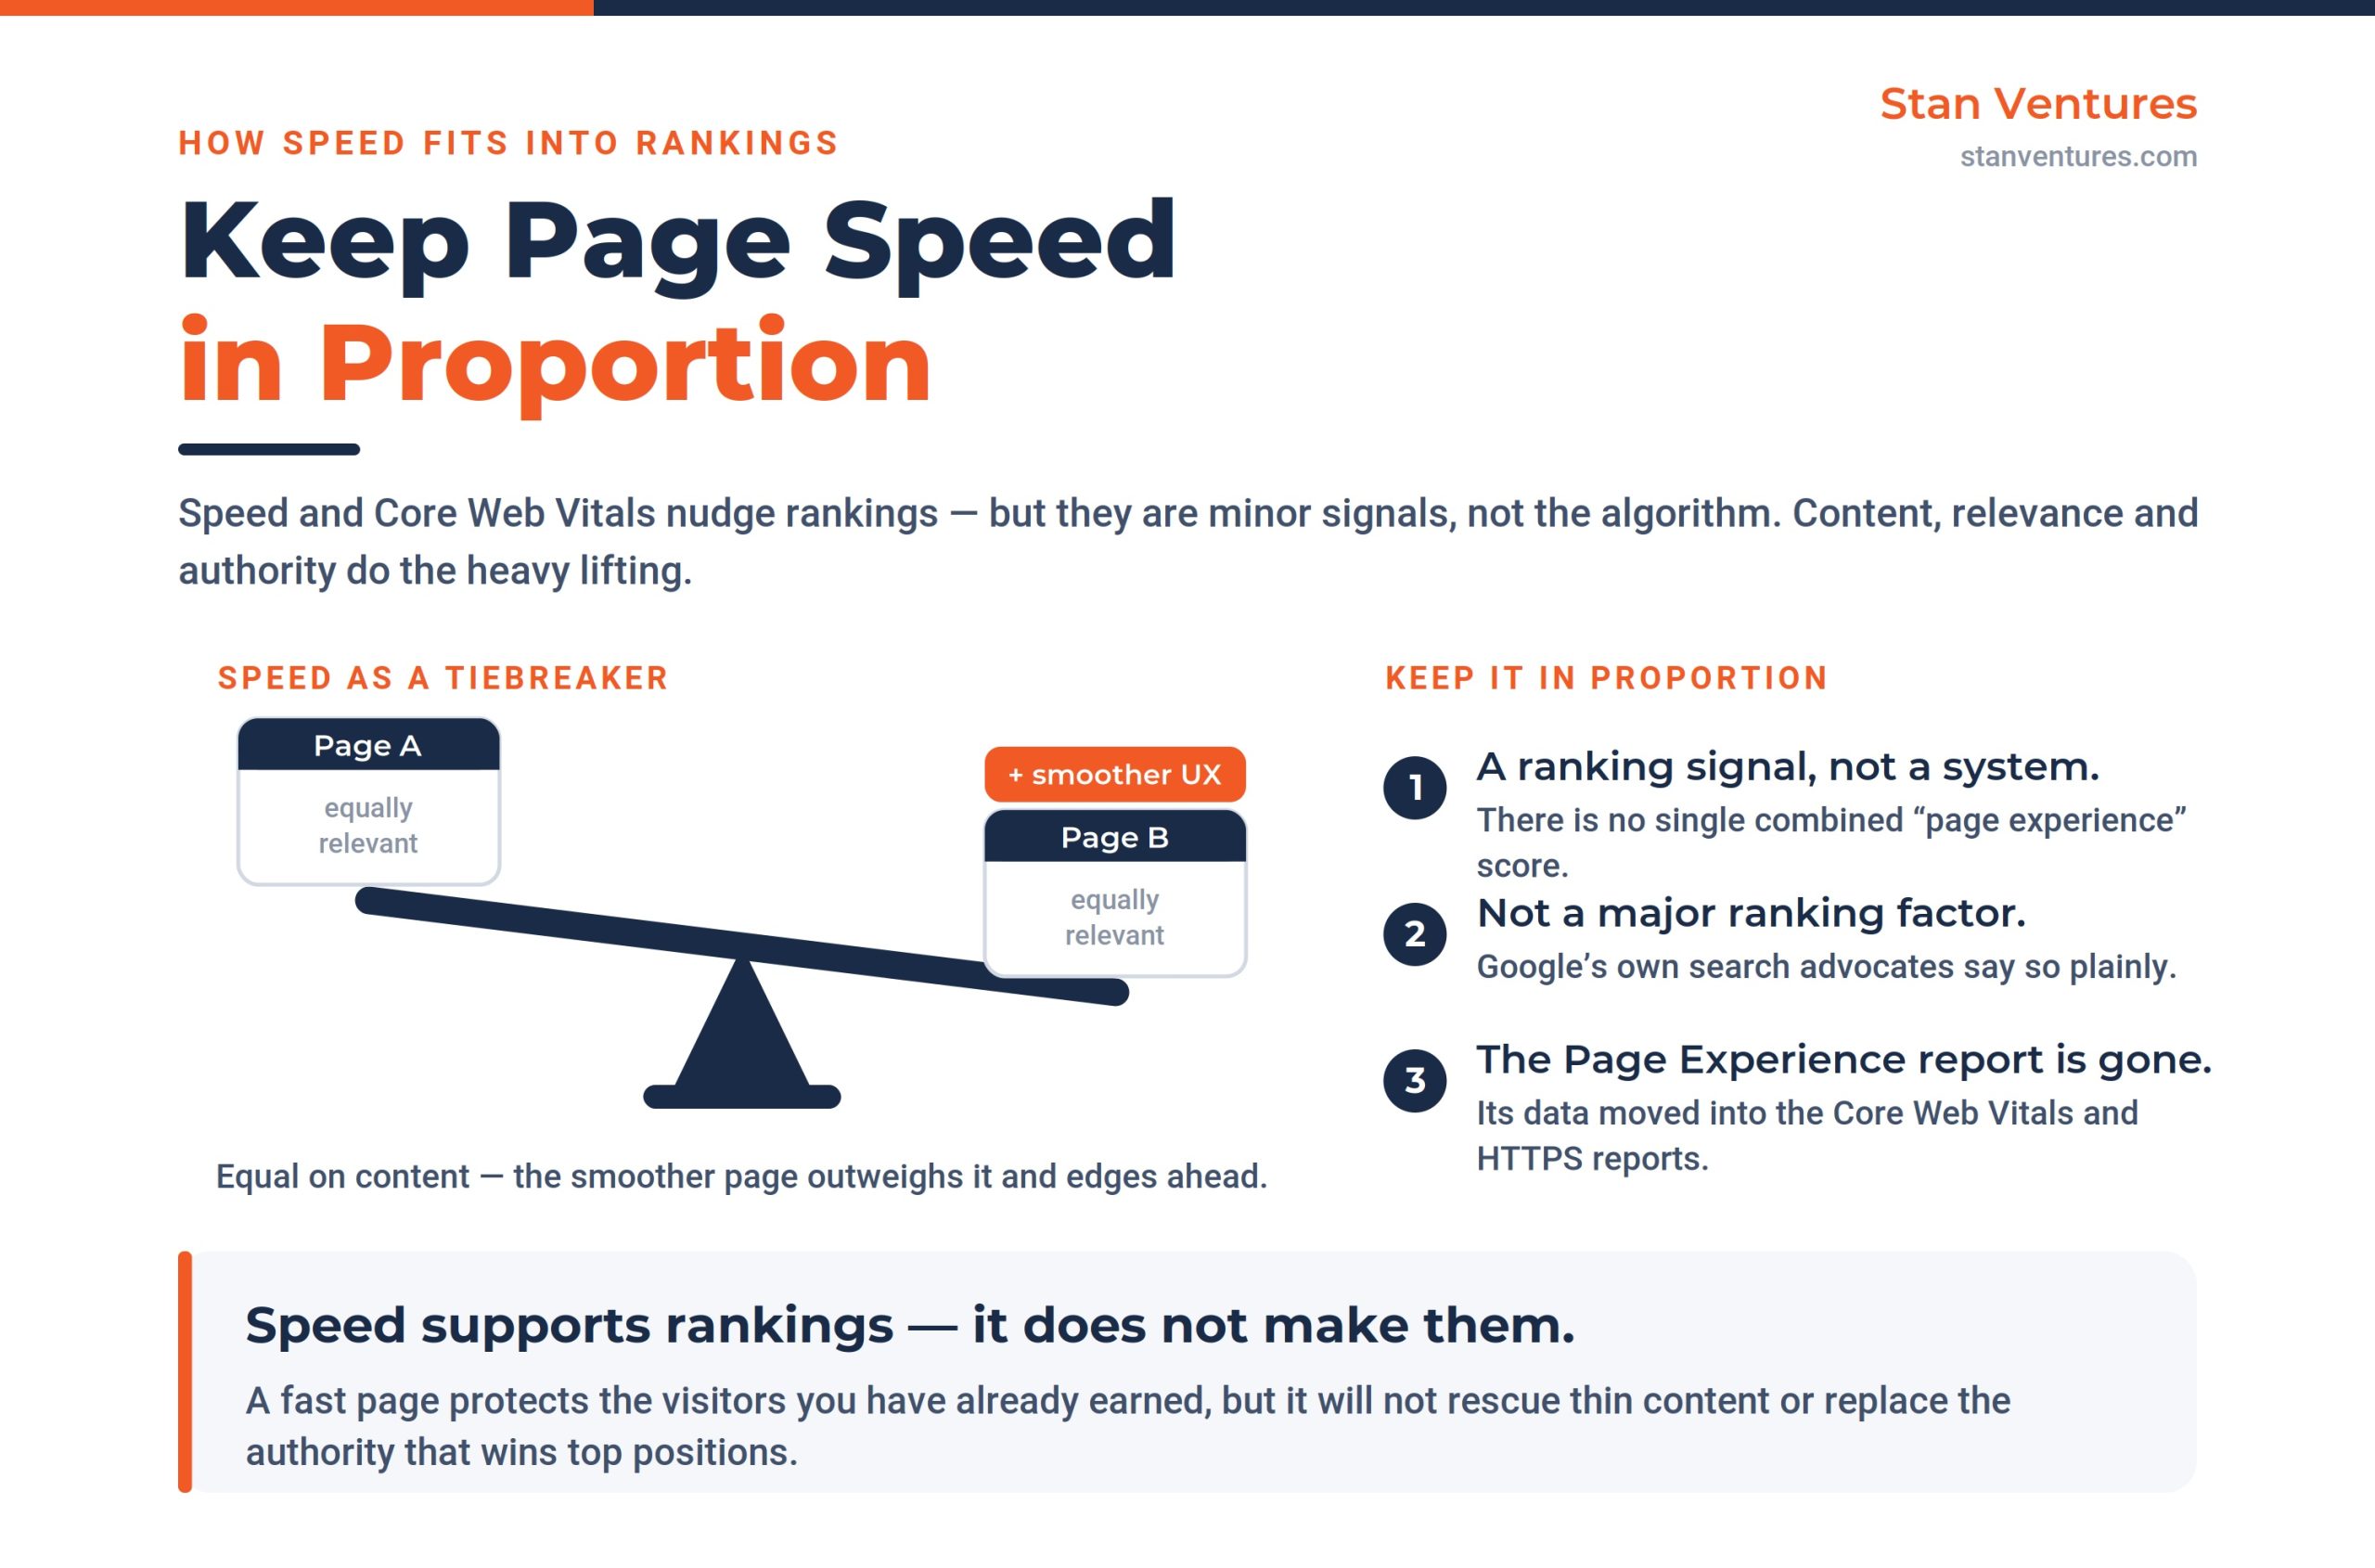
The takeaway is to keep speed in proportion. A good page load time supports rankings and protects the visitors you already attract, but it won’t rescue thin content, and it won’t substitute for the authority that earns top positions in the first place.
How to Measure Your Page Load Time
As Google evaluates real-user data, the most important distinction in measurement is between field data and lab data, and it explains why your tools disagree.
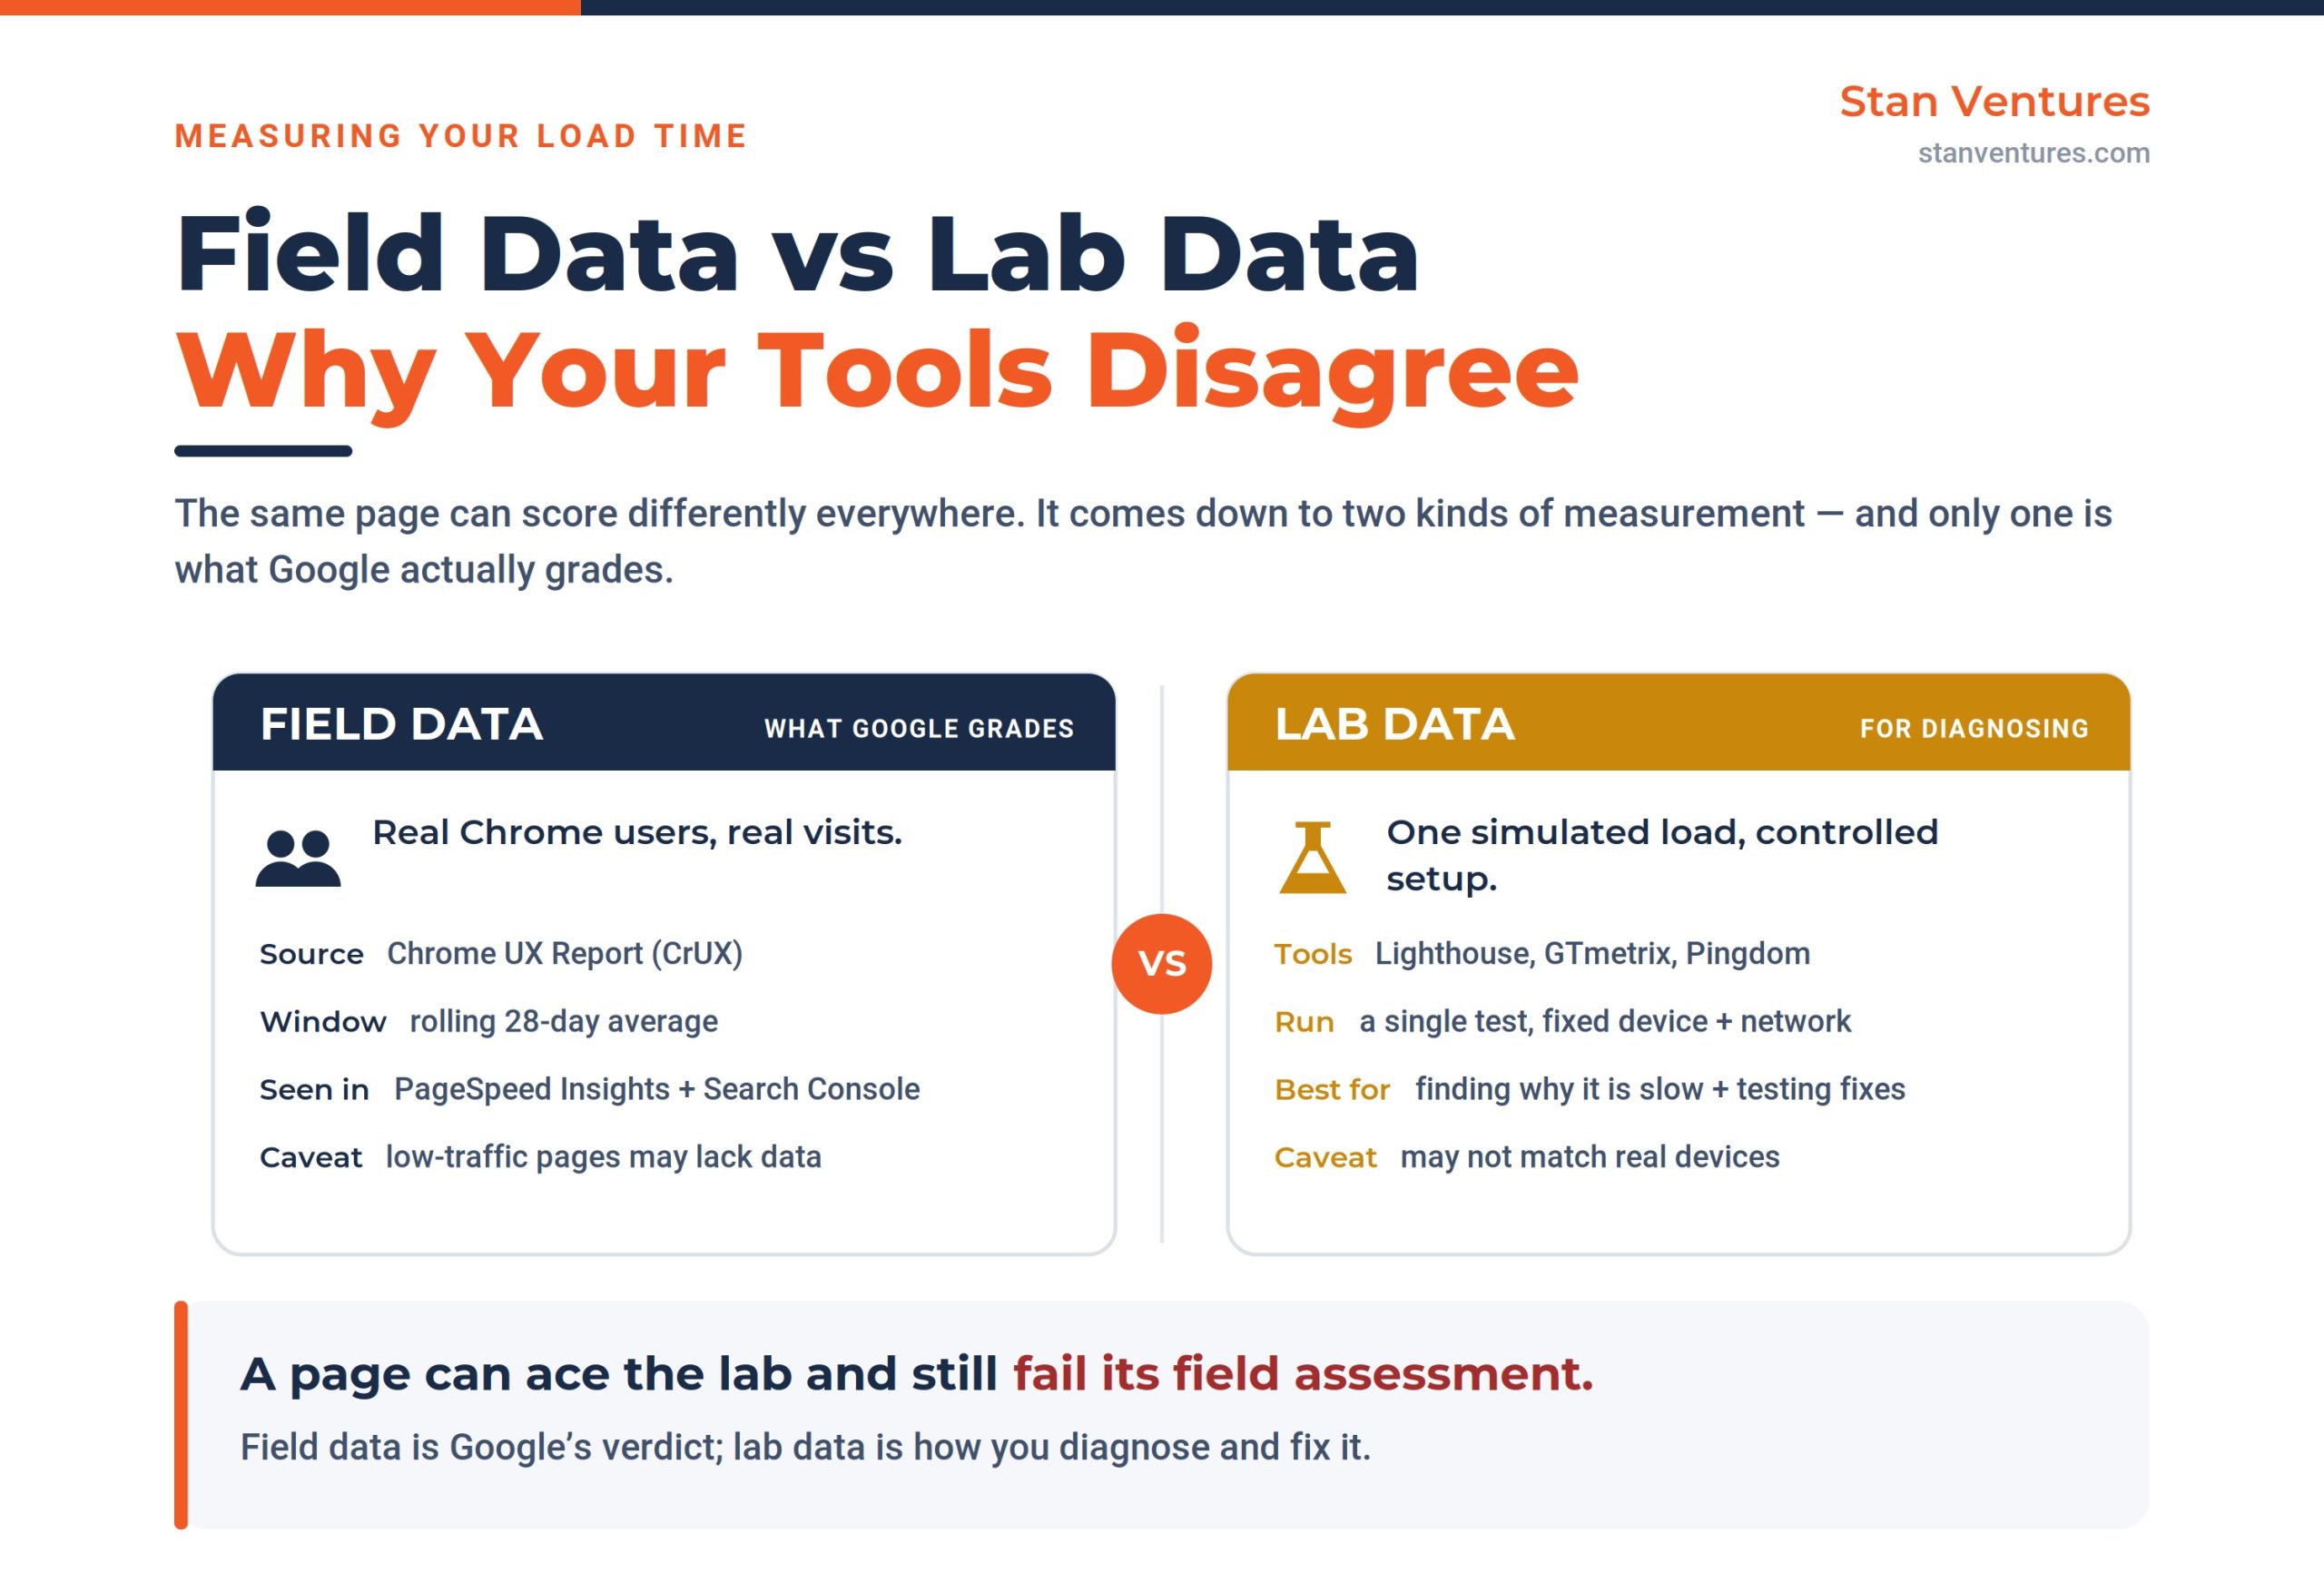
Field data reflects what real Chrome users actually experienced, gathered through the Chrome User Experience Report over a rolling 28-day window. It’s the data that feeds Google’s assessment, and it’s what you’ll see in the “field” section of PageSpeed Insights and in Search Console. The trade-off is that new or low-traffic pages may not have enough samples to report it.
Lab data is a single simulated load run under controlled conditions: the kind of score that tools like Lighthouse, GTmetrix, or Pingdom produce. It’s invaluable for diagnosing why a page is slow and for testing fixes before they ship, but it doesn’t represent the range of devices and connections your real audience uses. A page can post a near-perfect lab score and still fail its field assessment.
For a complete picture, the workflow is to start with field data where it exists (the honest measure of how the page performs for real people), then use lab tools to investigate specific problems.
Diagnostic metrics like First Contentful Paint and Time to First Byte aren’t Core Web Vitals themselves, but they help pinpoint whether a slow LCP traces back to a sluggish server or render-blocking resources.
The practical advice many SEOs miss is to stop chasing a single number across multiple tools and instead read the field data as the verdict and the lab data as the explanation. Google’s PageSpeed Insights documentation details exactly how both sources are calculated.
How to Actually Hit the Benchmark
Reaching a good page load time is less about installing a magic plugin and more about removing the specific things slowing each metric down. In our own testing across in-house sites, surface-level fixes, a cache plugin, minified CSS, lazy loading toggled on, produced flattering lab scores while barely moving the field-measured Core Web Vitals. The work that actually moves the needle is targeted, and it helps to prioritize by metric.
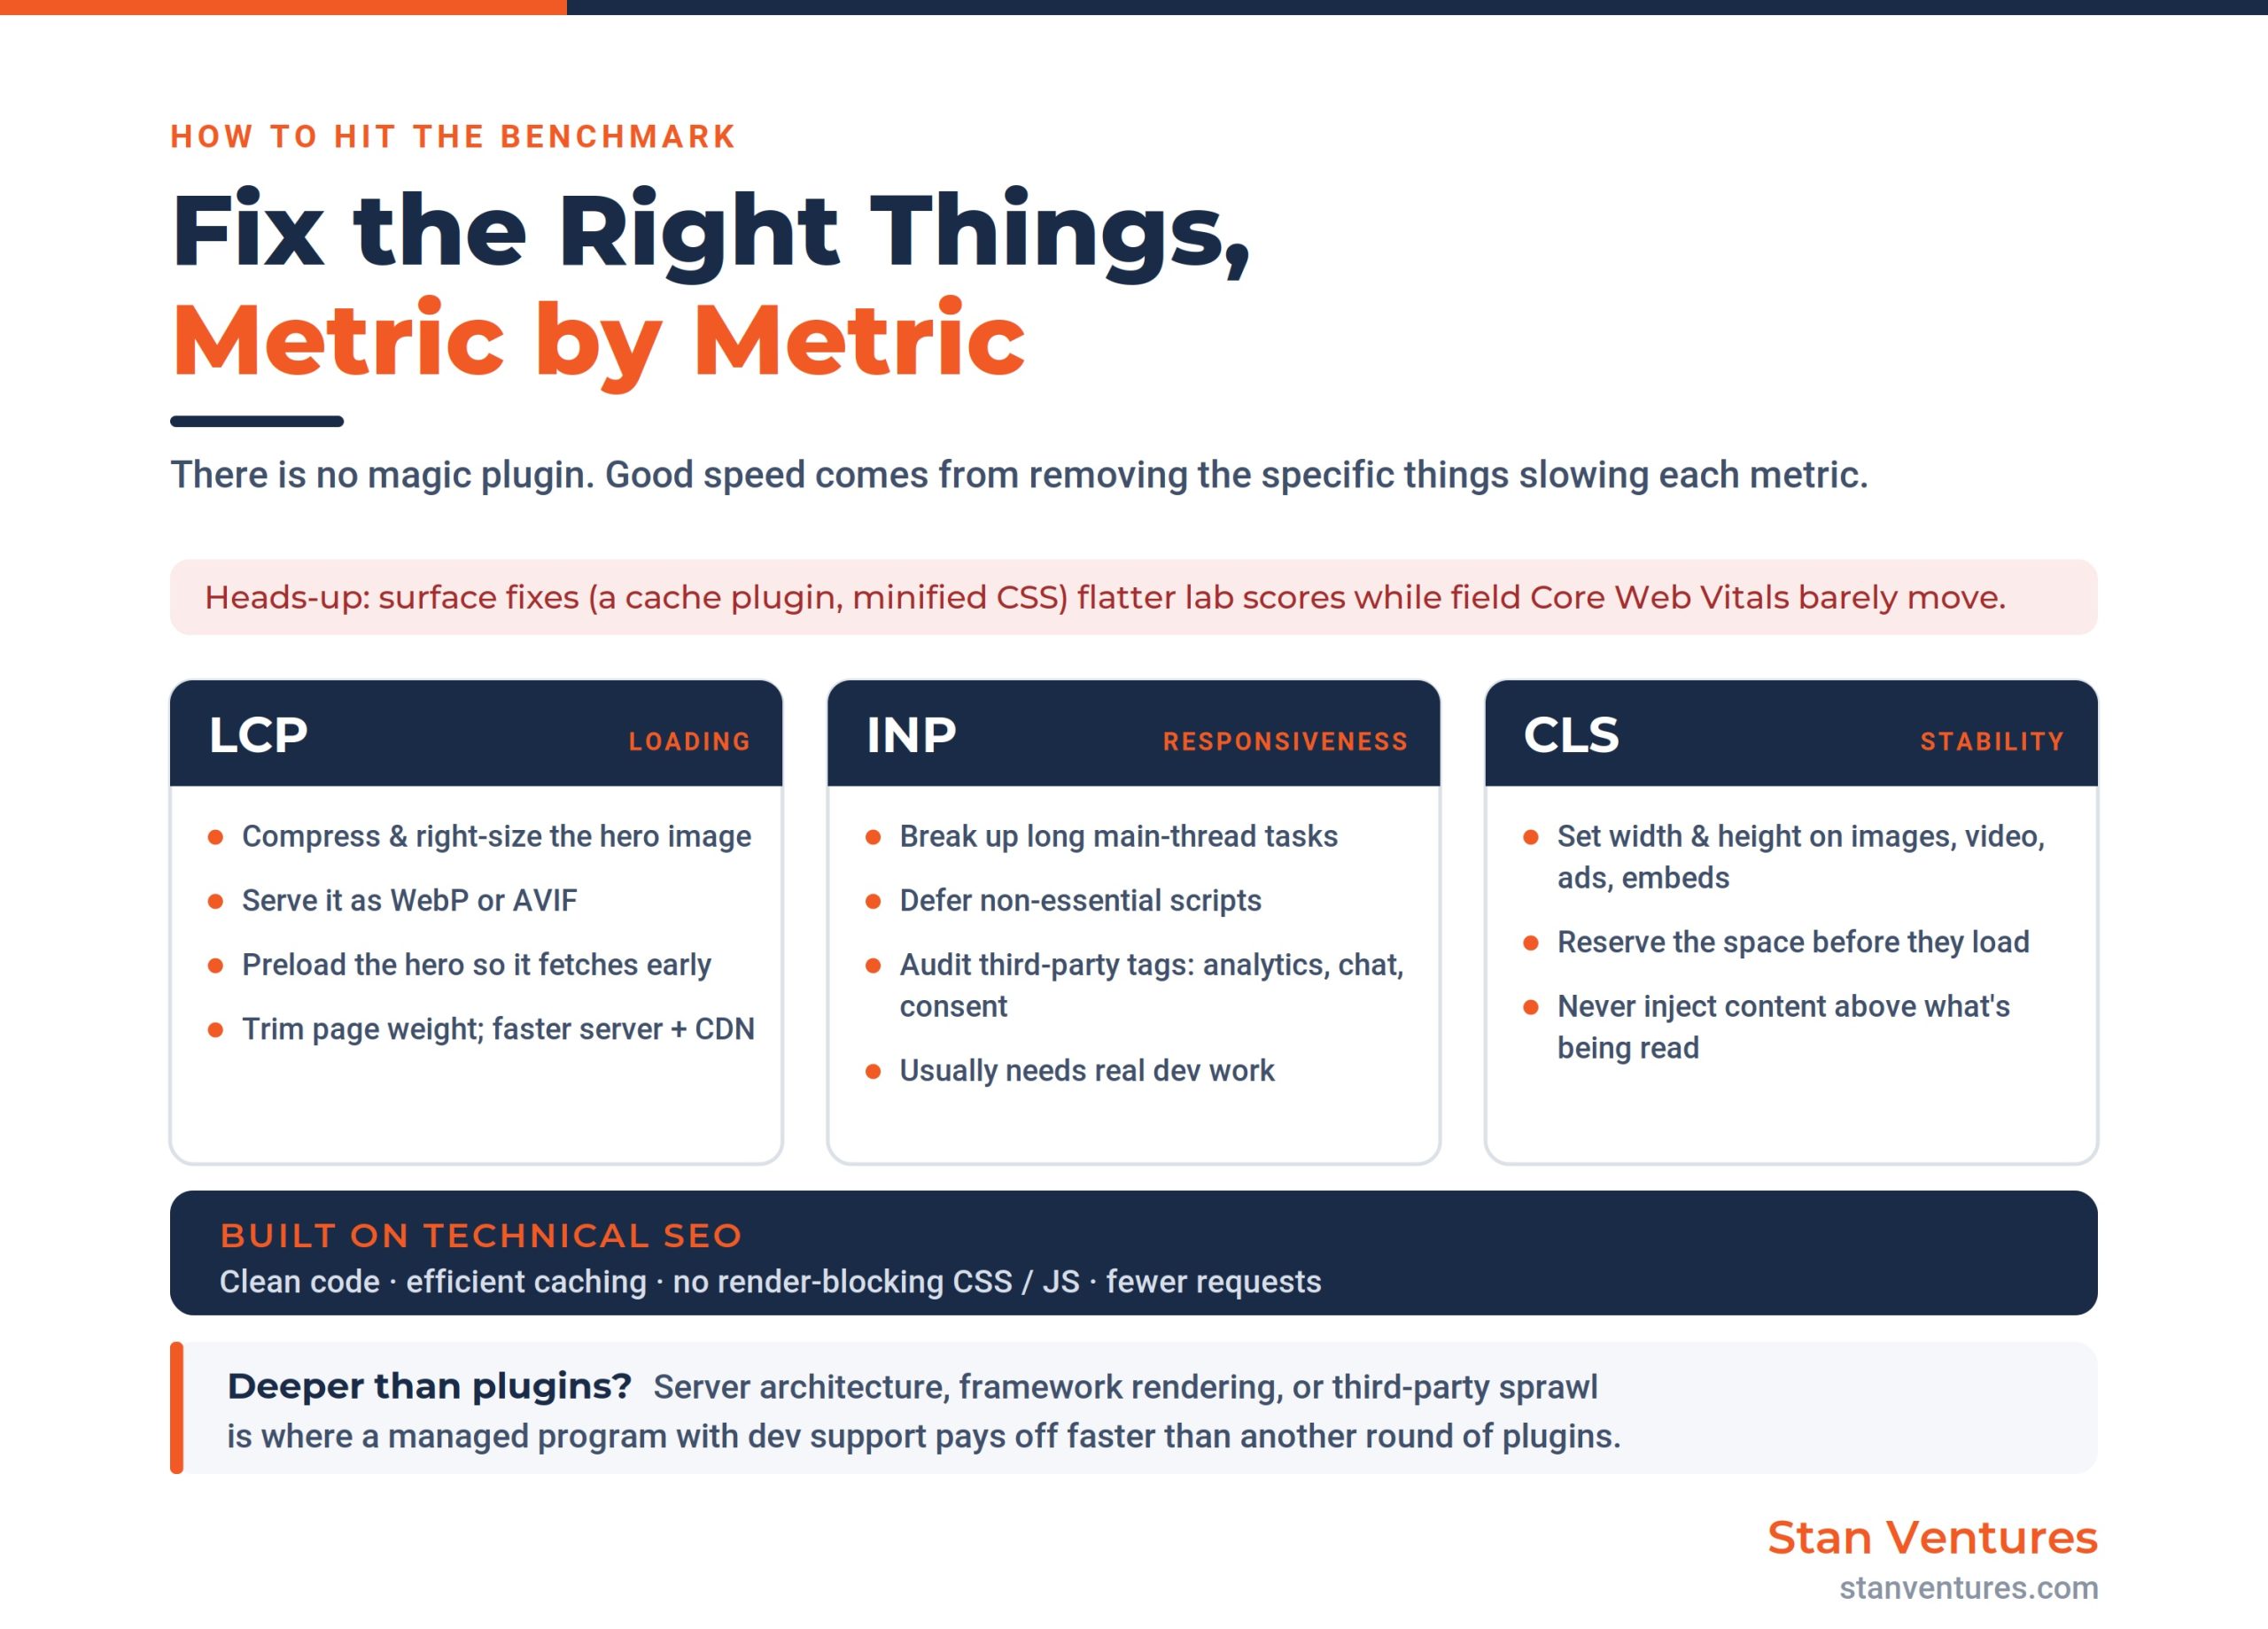
To improve LCP (loading), focus on the largest visible element. Compress and correctly size the hero image, serve it in a modern format like WebP or AVIF, and preload it so the browser fetches it early. Cut down total page weight: heavier pages render slower, and page size has a direct line to load time and Core Web Vitals. Improving server response time and serving assets through a CDN closer to the user attacks the same problem from the infrastructure side.
To improve INP (responsiveness), the lever is almost always JavaScript. Break up long tasks that block the main thread, defer non-essential scripts, and audit third-party tags, such as analytics, chat widgets, consent banners, that compete for the same thread as your interface. This is the metric that resists quick fixes and usually requires real development work.
To improve CLS (stability), give every image, video, ad slot, and embed explicit dimensions so the browser reserves space before they load, and avoid injecting content above what the user is already reading.
Underpinning all of this is solid technical SEO: clean code, efficient caching, eliminating render-blocking CSS and JavaScript, and trimming unnecessary requests.
Mobile Page Load Time Deserves Its Own Benchmark
The same page almost always scores worse on mobile than on desktop, because phones run on slower processors and less reliable connections. That gap is not a rounding error to ignore; it’s the version of your site most of your audience sees.
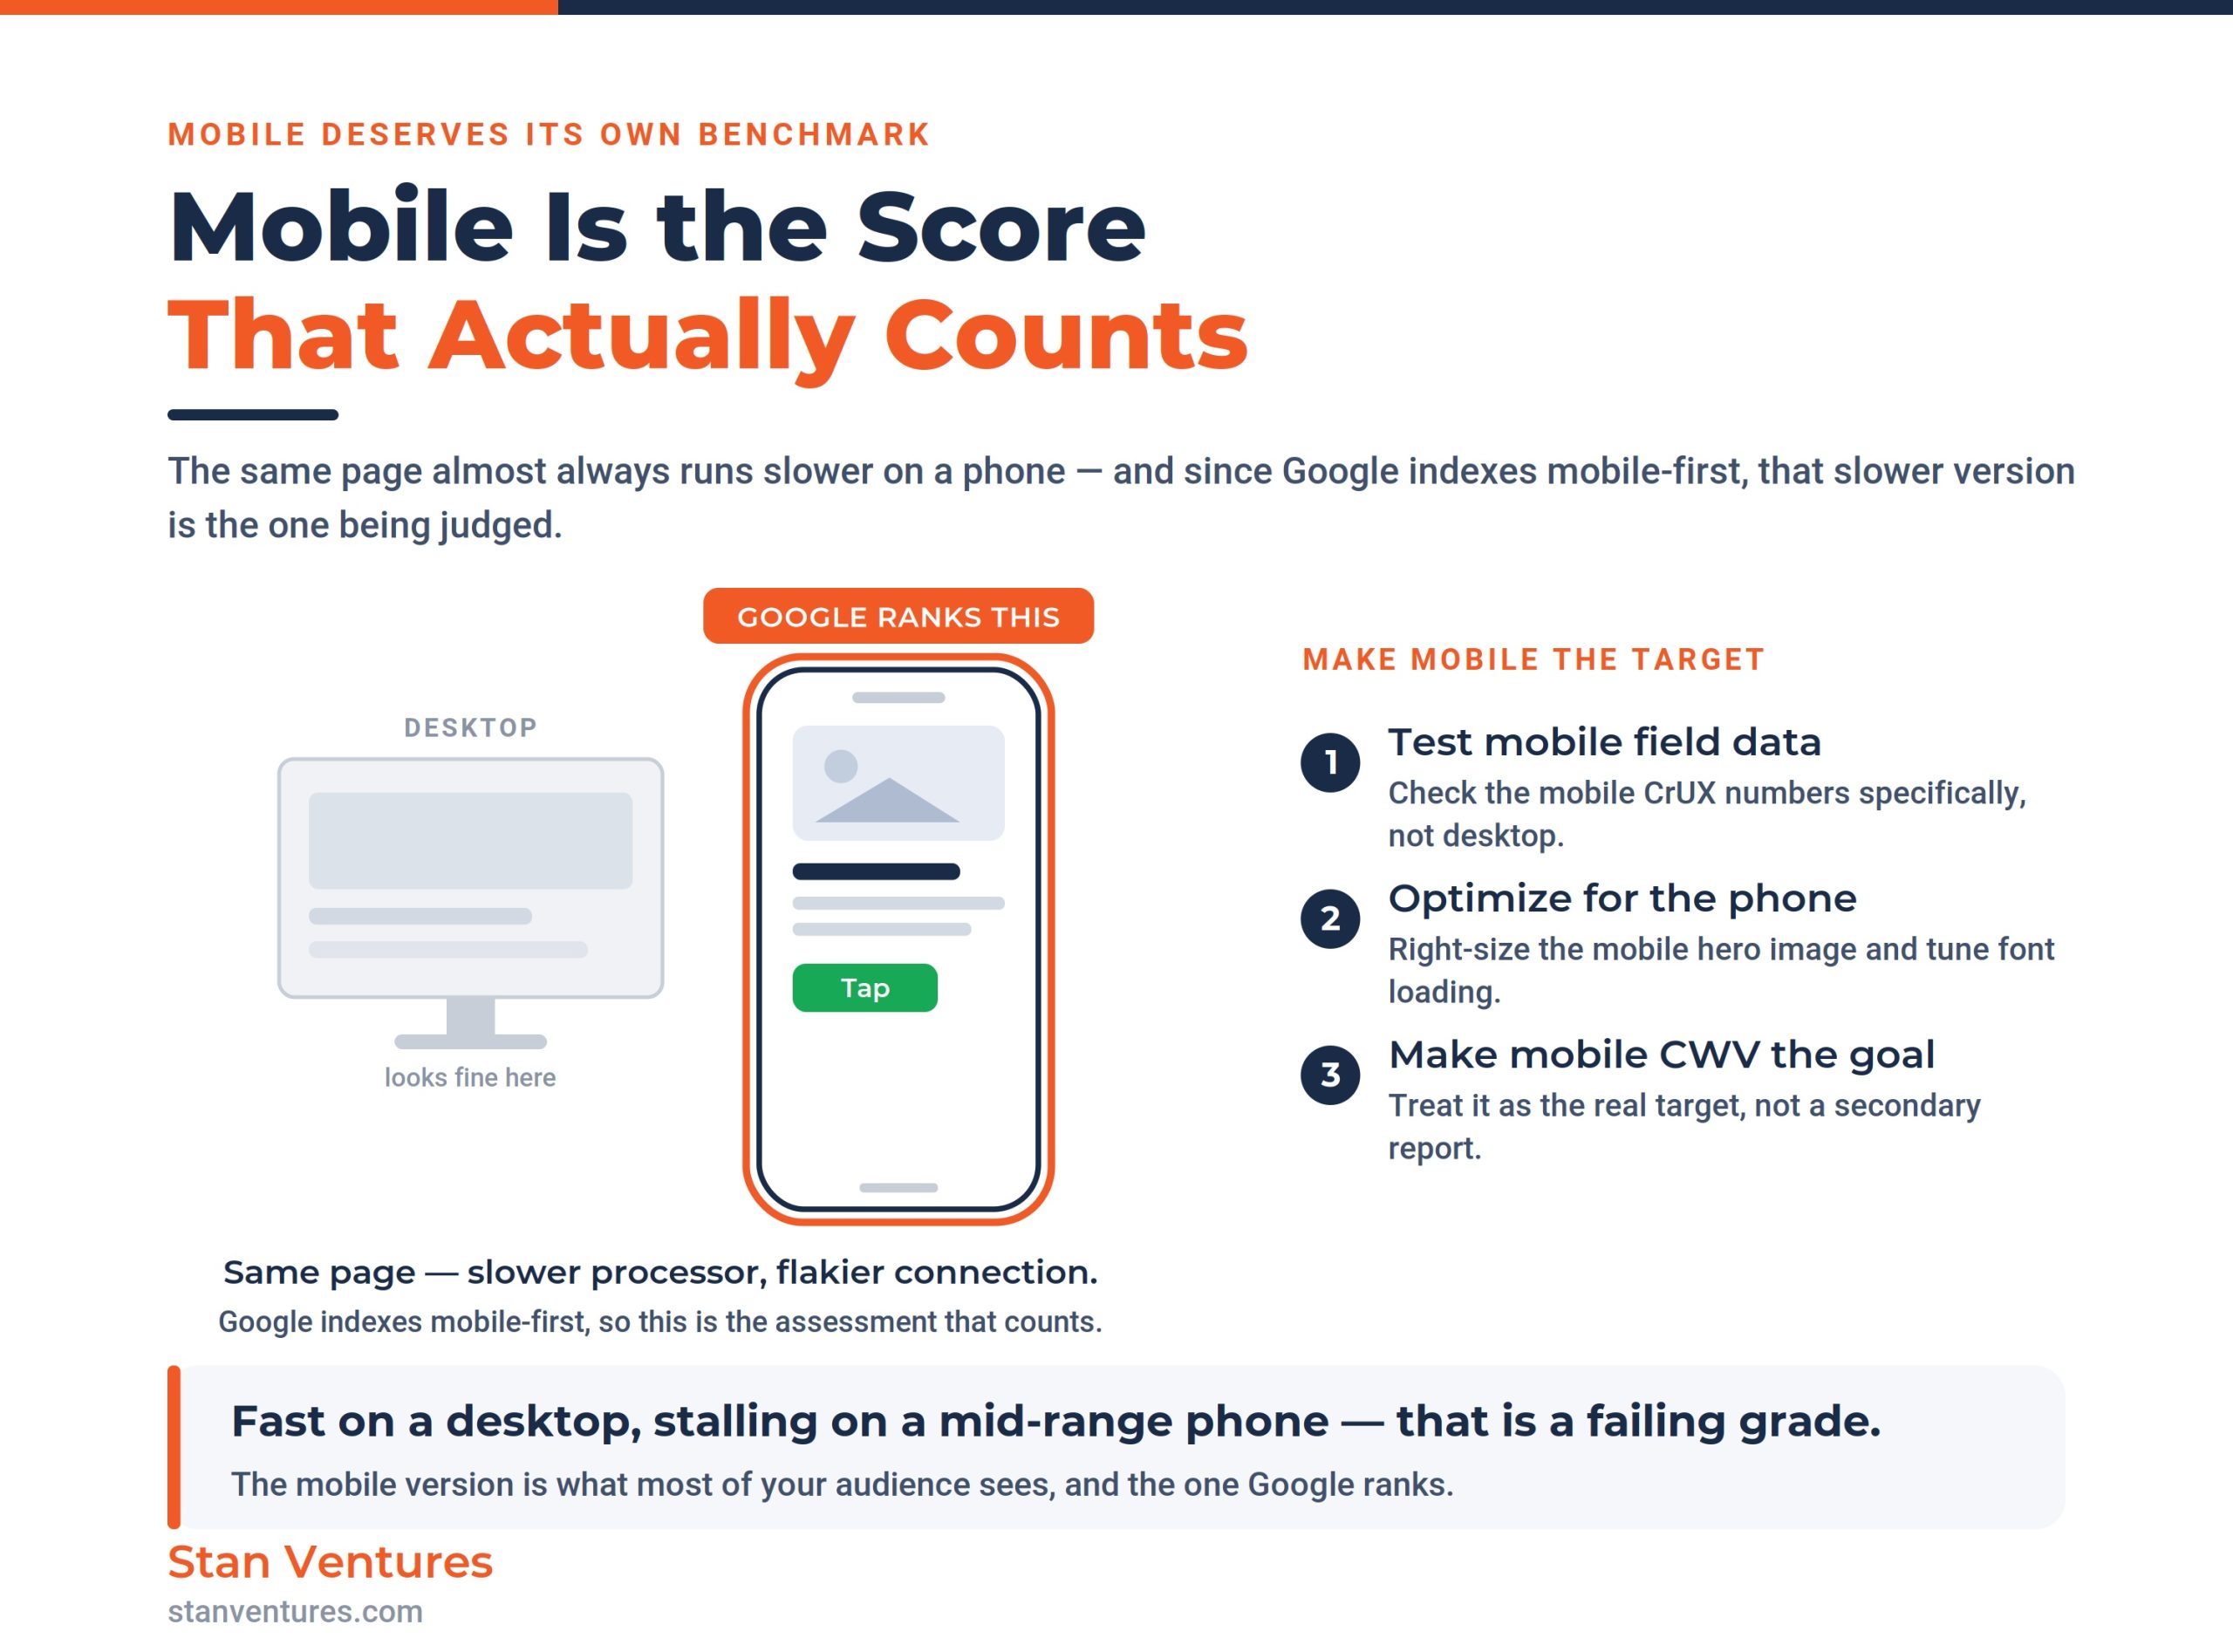
Since Google evaluates pages using mobile-first indexing, the mobile experience is what primarily determines how a page is understood and ranked. A site that loads comfortably on a developer’s desktop but stalls on a mid-range phone over a cellular network is failing the assessment that counts. Practically, that means testing on mobile field data specifically, optimizing the mobile hero image and font loading, and treating the mobile Core Web Vitals as the real target rather than a secondary report.
The Real Answer
The “Google recommended page load time” is best understood in two layers. The rule of thumb, under three seconds, ideally under two, is a sound target and a useful proxy. But the benchmark Google actually measures is Core Web Vitals at the 75th percentile of real visits: LCP at 2.5 seconds or less, INP at 200 milliseconds or less, and CLS at 0.1 or less.
Hit those, measure them with field data rather than a single lab score, and prioritize the fixes that move each metric. Do that and the page won’t just post a green number. Instead, it will hold onto the visitors you worked to attract and give your content a cleaner shot at ranking. Speed is the proxy. The experience is the goal.

Dileep Thekkethil
AuthorDileep Thekkethil is the Director of Marketing at Stan Ventures, where he applies over 15 years of SEO and digital marketing expertise to drive growth and authority. A former journalist with six years of experience, he combines strategic storytelling with technical know-how to help brands navigate the shift toward AI-driven search and generative engines. Dileep is a strong advocate for Google’s EEAT standards, regularly sharing real-world use cases and scenarios to demystify complex marketing trends. He is an avid gardener of tropical fruits, a motor enthusiast, and a dedicated caretaker of his pair of cockatiels.