Google aims to provide the best user experience possible to keep people using its search engine. However, some factors affecting user experience are beyond Google’s control. For example, when a user clicks on a search result and lands on a slow-loading page, Google can’t control that experience. But what it can do is lower the search ranking of slow-performing websites.
To help with this, Google has introduced Core Web Vitals, a set of guidelines that measure how well a webpage performs in terms of user experience. These guidelines are integrated into Google’s Page Speed Insights tool and also in its Chrome browser under the LightHouse feature.
Key Metrics of Core Web Vitals
Core Web Vitals focuses on three main metrics:
- Largest Contentful Paint (LCP): Measures how quickly the main content of a page loads.
- Interaction to Next Paint (INP): measures the responsiveness and visual feedback of a page.
- Cumulative Layout Shift (CLS): Measures how much the layout of a page shifts as it loads.
Core Web Vitals As Ranking Signals
Although Core Web Vitals are just one of many factors that Google uses to rank webpages, they can be a tiebreaker when the quality of content is similar between two sites. In such cases, the site with better Core Web Vitals scores may rank higher.
Google updated its page experience documentation on March 12, 2024, with significant changes that reaffirm the importance of Core Web Vitals and other page experience signals as ranking factors.
The page experience signals include HTTPS, intrusive interstitial elements, and, of course, the Core Web Vitals. The newly updated document states that achieving good scores in Core Web Vitals is highly recommended for success in attaining higher search rankings. However, it notes that other page experience factors may not directly impact search rankings.
That said, Google reiterates that focusing solely on Core Web Vitals will not suffice for a page to rank well. There are other ranking signals that assess the quality of the content and the authority of the website before determining its position in search results.
Core Web Vitals will play a significant role as a major ranking factor when Google identifies a number of websites providing high-quality information to users. In such cases, Google will prefer to rank sites that offer a good page experience over those providing a subpar experience to users.
Google’s clarification aims to diminish confusion regarding the role of page experience in search rankings.
How Can Core Web Vitals Help You?
Beyond affecting Google rankings, Core Web Vitals can help website owners identify issues that could be harming their business. For example, if a payment page has a shifting layout that disrupts the user during checkout, that’s a problem. By aligning your website with Core Web Vitals metrics, you can improve user experience, encouraging visitors to stay longer and engage more with your content.
So, if you want to perform well in Google search results, it’s crucial to pay attention to these metrics.
1. Largest Contentful Paint (LCP)
This measures how long it takes for the main content on a page to load. In simple terms, it’s the time from clicking on a link to seeing most of the content on the screen. A good LCP score means the page loads quickly, which is important because slow-loading pages can frustrate users.
Ideal Time: Less than 2.5 seconds
2. Cumulative Layout Shift (CLS)
This measures how much the elements on a page move around while it’s loading. Have you ever tried to click a button, only to have it move and you end up clicking something else? That’s what CLS measures. A low CLS score means the page is stable as it loads, making it easier for users to interact with it.
Ideal Score: Less than 0.1
3. Interaction to Next Paint (INP)
Google has replaced First Input Delay (FID) with Interaction to Next Paint (INP) since March 12, 2024.
This is one of the major updates that Google is bringing to web vitals after it was launched in 2021 and later announced as a ranking system that determines the position of websites on SERP.
What is INP
INP unlike First Input Delay, which measures the time the browser takes to process the first interaction of a user that could be a click, tap or scroll. With INP, Google now measures time from when the user interacts to when the browser can show the new content.
The key difference between both is that while FID focuses on the responsiveness of a page when a user first tries to interact with it, INP takes into account the responsiveness and visual feedback of a page over the entire lifespan of a page visit, not just the first interaction.
Is INP a Google Ranking Factor?
Since webvitals compliance is collectively considered by Google as a ranking factor, INP naturally becomes a critical element that can determine the position of your website on Google’s search result. Google considers INP less than 200 milliseconds as good and anything below 500 milliseconds as poor.
You can check the INP of any webpage by checking the Chrome User Experience Report (CrUX). Additionally, you can use Google Search Console to check the INP of domains that you have verified.
Both these tools can help you understand the site’s performance over time and identify areas that need improvement.
Improving Your INP Score
To enhance INP scores, understand the CPU processes involved in user interactions. These include the delay before the browser can start processing an interaction, the time to run interaction-related code, and the delay in updating and displaying new content. Chrome DevTools can help identify what slows down interactions, but interpreting this data might require a developer’s help.
Ideal Score: Less than 200 milliseconds.
By optimizing these three metrics, you can offer a better user experience, which not only keeps visitors on your site longer but also helps improve your site’s ranking in Google search results.
Checking Core Web Vitals Score – Real User Metrics vs. Lab Data
As said earlier, you can check the Core Web Vitals score of your pages using the Lighthouse feature inside the Chrome browser or using the PageSpeed Insights tool. However, it’s important to note that these tools have their limitations.
Real User Metrics
It’s crucial to understand that Core Web Vitals are based on real-world user metrics. These are the experiences of actual people interacting with your website. The data you see as part of the core web vitals diagnosis may not be the actual result as it’s based on lab data.
Lab Data for Debugging
While real-world data is invaluable, you can also use lab data for debugging. Lab data is generated and measured on your own devices, giving you a rough idea of potential issues that might affect real users.
Lighthouse vs Performance Panel in Chrome
Lighthouse is a tool available in Chrome’s developer tools that provides an initial audit of your webpage’s performance, including Core Web Vitals. On the other hand performance panel allows you to record the performance of a page during user interactions, making it easier to spot issues related to layout shifts or responsiveness.
Lighthouse is excellent for evaluating the initial page load performance. However, it doesn’t capture issues related to layout shifts or responsiveness that might occur as users interact with the page, which is one of its major limitations.
This is where you can use the performance panel. It provides an overview of all browser tab activity, including network requests and JavaScript code execution. It also offers a Web Vitals timeline and additional details on what’s happening behind the scenes.

The Performance Insights feature information in a more digestible timeline form, allowing you to understand how network requests, JavaScript code, and Core Web Vitals interact.

One of the significant advantages of using lab data is that it allows for ongoing monitoring during development. This proactive approach helps you identify and fix issues before they affect real users, rather than reacting to problems after they occur.
How to Improve Core Web Vitals Score?
Don’t think that optimizing websites for better page speed experience is the task of the developer?
SEOs have to be equipped with technical knowledge in order to keep pace with the changing trends.
If you’re not familiar with coding, you should try to understand how the fixes will improve the site speed and user experience. This is very critical if you want to give the right instructions to the developers.
Installing a cache plugin, minimizing the CSS and JavaScript can all help in speeding up the site and these are some of the fixes that even a newbie SEO can do. But will all this improve the Web Vitals?
The answer to this question is both Yes and No. The reason being that some of the fixings can help in making a little improvement, but when it comes to the goal of improving the web vitals, they have little impact.
This is quite evident in the research done here at Stan Ventures. We analyzed the Web Vitals score of some of the in-house websites after making minor changes.
- Installed a Cache Plugin
- Minimized the CSS
- Minimized JavaScript
- Used Defer Attribute
- Enabled GZip
- Enabled LazyLoad
The result was nothing impressive worth sharing. The GTMetrics and Pingdom tool said we were doing great, but the Google Web Vitals Extension said the page experience signals sucked.
The bottom line of our research was that moving the elements from top to bottom and removing the render-blocking javascript will all help you only if you have the strong technical backing.
Here is why:
1. Server response time can be improved by installing a cache plugin, but it only works when the users revisit your site. This is very useful when your users browse through multiple pages. But let’s say that you haven’t set the right expiry for the resources, the whole purpose of adding the cache plugin may be futile.
2. Making drastic changes to the load sequence of JavaScript and CSS can result in bad page experience. Those you may get a 90+ rating on third party tools, users may experience volatile changes as the page unfolds in the browser.
3. There is no one panacea for all the fixes for page speed. If you are running a WordPress site, or any other CMS, you need to install multiple plugins for optimization. This can further deteriorate the speed of the site.
Optimizing Images for Core Web Vitals
One of the prime reasons for bad page experience is the heavy payload of images that are rendered by browsers as page loads.
Better image optimization will speed up the site and help you to achieve the perfect Web Vitals score. Here are a few quirky ways to optimize images:
Use Image CDN: If you have an image-heavy design, your server is already stressed out when delivering the resources to the user’s browser. It also provides other resources within the payload simultaneously to the browser, making the user wait long for the whole page to load.
Using the image CDN servers, you take the pressure off from your server as the images are served using CDN servers in the closest proximity to the user’s location. Currently, AWS and CloudFlare are the best Image CDN providers in the market.
WebP Format: Ever tried using the WebP format for your images? This is a Google-approved image format that reduces the image size by at least 36% compared to JPEG.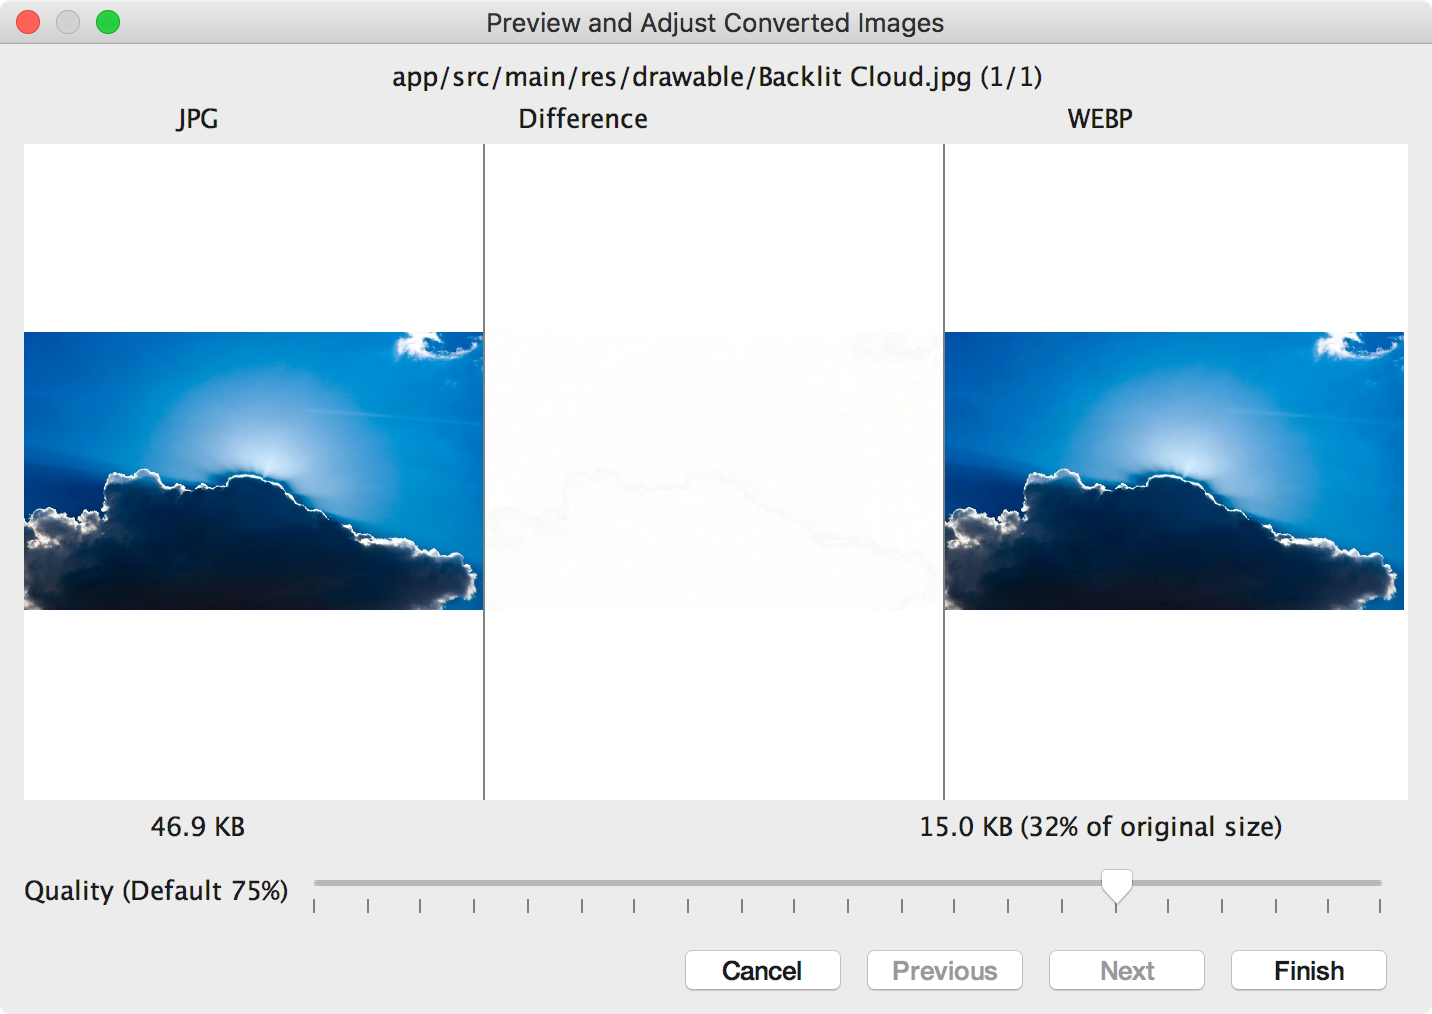
Most of the modern-day CDNs deliver images in WebP format as it supports transparency, and typically provide 3× smaller file sizes compared to PNG.
LazyLoad: LazyLoad has been there for a long time, and this is a tried and tested strategy to reduce the load speed.
We found that lazy loading images will improve the web vitals score as the server is not loaded with image requests all of a sudden.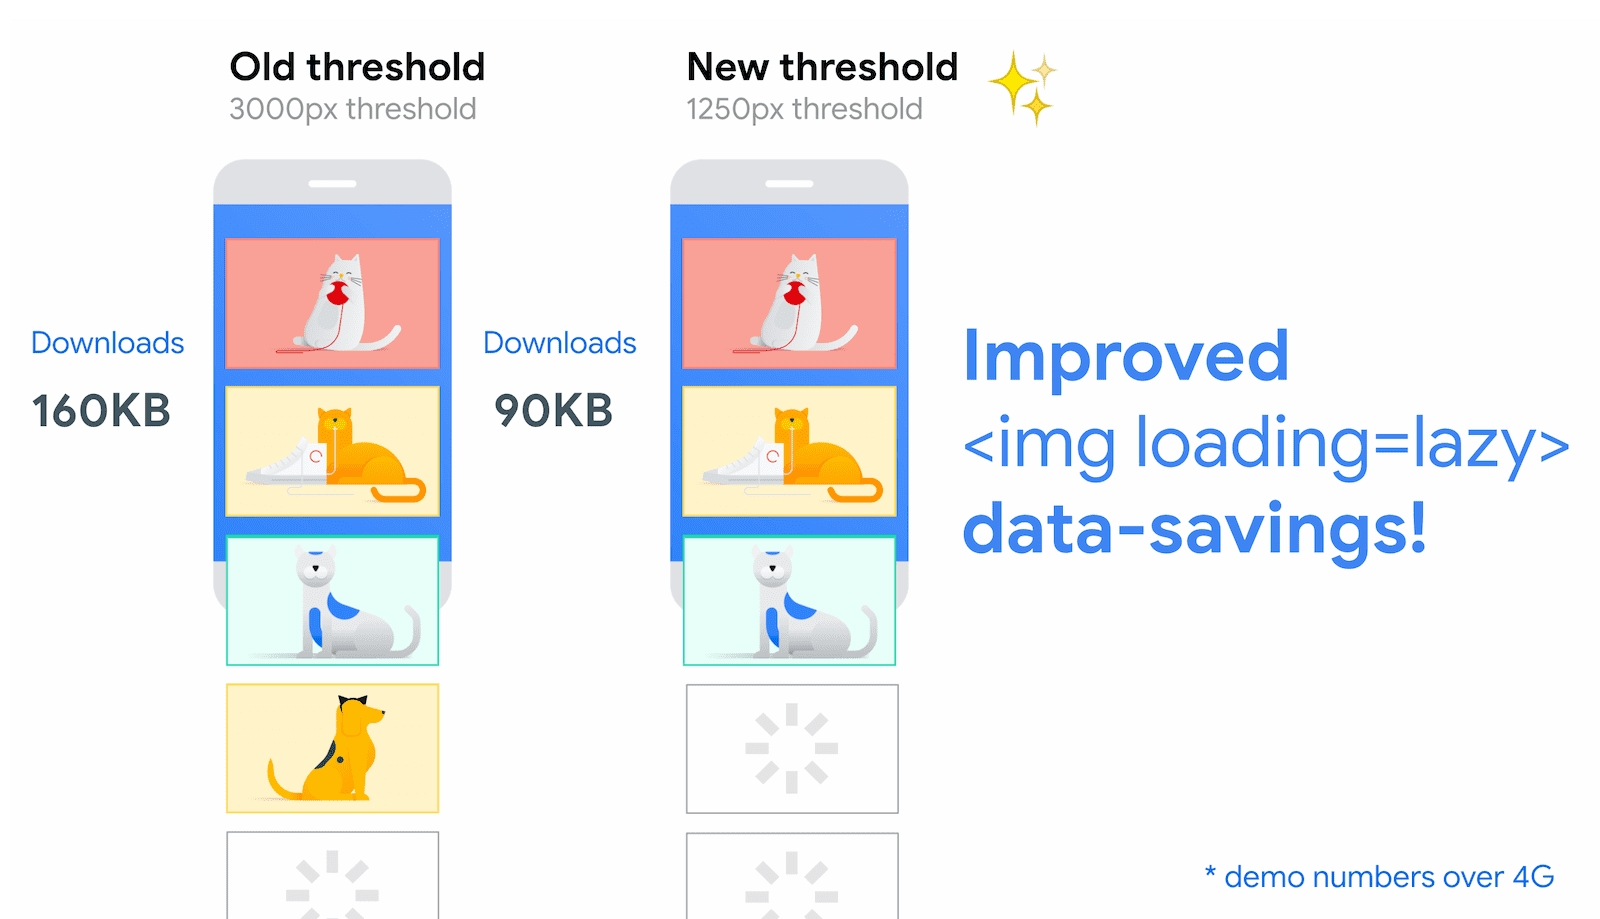
With LazyLoad enabled, only the initial set of images are rendered while users land on the page, giving them a seamless user experience.
The other images load only when the users reach the particular viewpoint.
Optimizing Java and CSS
- GZIP Compression

When you enable GZIP compression, it can reduce the size of the transferred resource significantly, and hence reduces the time to download the resources as well. GZIP compression has become a standard practice for the majority of websites.
- Minifying Resources

Minification is the process of removing redundant data from your JS and CSS files. It is done to reduce load time on websites and bandwidth usage.
To minify JS, CSS and HTML files, comments and extra spaces need to be removed. This can be done with the help of most optimization plugins.
- Combine Javascript and CSS

When you combine Javascript and CSS files, it reduces the number of requests and speeds up the process of rendering. For example, if your page loads 5 external Javascript and CSS files each, combining them will result in 8 lesser requests.
Moreover, CSS files are all rendered blocking, which means the more CSS files are loaded, the more likely it is to interrupt a page’s critical path. Multiple Javascript files can also limit the parsing of your HTML document when deferred improperly.
- Reduce Render Blocking
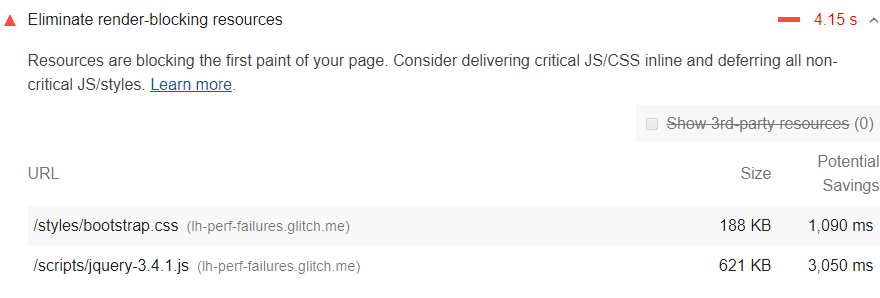
Slow PageSpeed is often the result of excessive use of Javascript and CSS. Before eliminating render-blocking scripts, you need to identify which scripts are causing the problem. You can use the PageSpeed Insights tool to analyze which scripts are slowing down your site.
You can force JS files to wait to load until other elements of the page are ready. One of the most sought after ways to defer JS is through asynchronous loading.
- Deliver Javascript and CSS using CDN

Unless you use CDN, you are using your server bandwidth for loading Javascript and CSS files. It is possible to reduce the load on your server without the CDN, but only to a certain extent.
We’ve analyzed that websites that have enabled the below features successfully reduced the server load and allowed faster rendering.
- Optimizing the Font
Custom fonts may make your site look really attractive, but such font rendering behavior can increase the load on servers and slow down your site.
To fix this issue, ensure that your CDN can override font rendering behavior.
By doing so, your CDN can swap the rendered text and display the original text as it loads on the CSS. Since both resources are delivered simultaneously from the same server, the actions occur in a few microseconds.
- Embed Codes
Embedded images and videos can slow down the speed of a website. Many businesses cannot choose to ignore these features on their site. For them, Google recommends lazy loading, which means that these media files will load only when promoted by the users.
Implementing this technique has shown a 70% performance improvement in LightHouse.

Dileep Thekkethil
AuthorDileep Thekkethil is the Director of Marketing at Stan Ventures, where he applies over 15 years of SEO and digital marketing expertise to drive growth and authority. A former journalist with six years of experience, he combines strategic storytelling with technical know-how to help brands navigate the shift toward AI-driven search and generative engines. Dileep is a strong advocate for Google’s EEAT standards, regularly sharing real-world use cases and scenarios to demystify complex marketing trends. He is an avid gardener of tropical fruits, a motor enthusiast, and a dedicated caretaker of his pair of cockatiels.